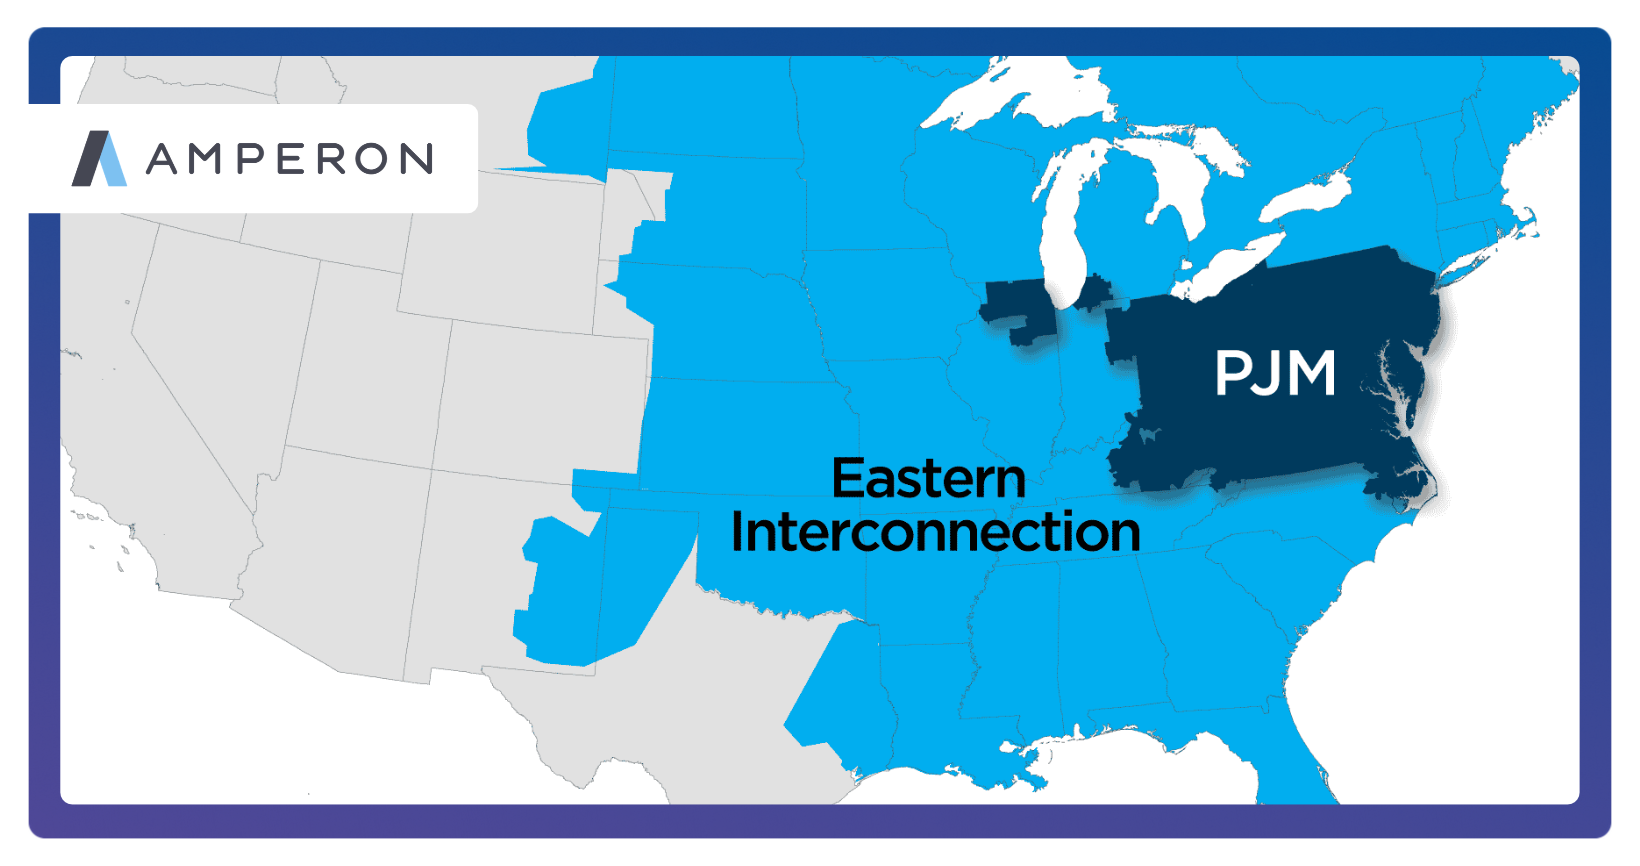
PJM stands for Pennsylvania, Jersey, and Maryland, but the PJM Interconnection extends beyond those state borders. In fact, PJM is the largest power market in the United States, and it claims to be the largest competitive wholesale electricity market in the world.
What is PJM?
PJM Interconnection is the regional transmission organization (RTO) that runs the power grid and wholesale electricity market for all or parts of 13 states and Washington, D.C. The PJM name comes from its origins as the Pennsylvania-New Jersey-Maryland Interconnection.
Today, PJM serves more than 67 million people, more than any other U.S. grid operator, and its peak load is roughly 30% higher than the next-largest market. It also covers some of the most consequential territory of any grid, from Chicago to the Pentagon and Northern Virginia’s Data Center Alley.
PJM dispatches the grid and runs the energy and capacity markets where generators, utilities, retailers, and traders buy and sell power. It also plans the transmission system within its territory. The power plants and power lines themselves belong to its members.
Aside from its size, two things set PJM apart from other U.S. power markets:
- It has a robust capacity market. Unlike ERCOT, PJM pays generators for both energy sold and capacity available. And unlike other leading markets like MISO, its capacity auction clears years in advance.
- Its demand is growing fast after years of flat load. Data centers, especially in Northern Virginia, are driving some of the fastest load growth PJM has forecast in decades. Amperon's PJM load growth analysis breaks it down by zone.
This guide explains how the PJM market works, what moves demand and prices, and where to find Amperon's deeper analysis on each topic.
PJM at a glance
Last updated: October 2026
Sources: PJM at a glance, PJM 2028/29 auction results, PJM network service peak loads, FERC Order 831 offer caps, CME PJM futures, Amperon on the July 2026 heat event, Amperon PJM load growth report.
PJM today: what's changed recently
Last updated: October 2026
PJM is moving from decades of flat demand to fast growth, and capacity prices have risen to the market's price cap. Recent developments include:
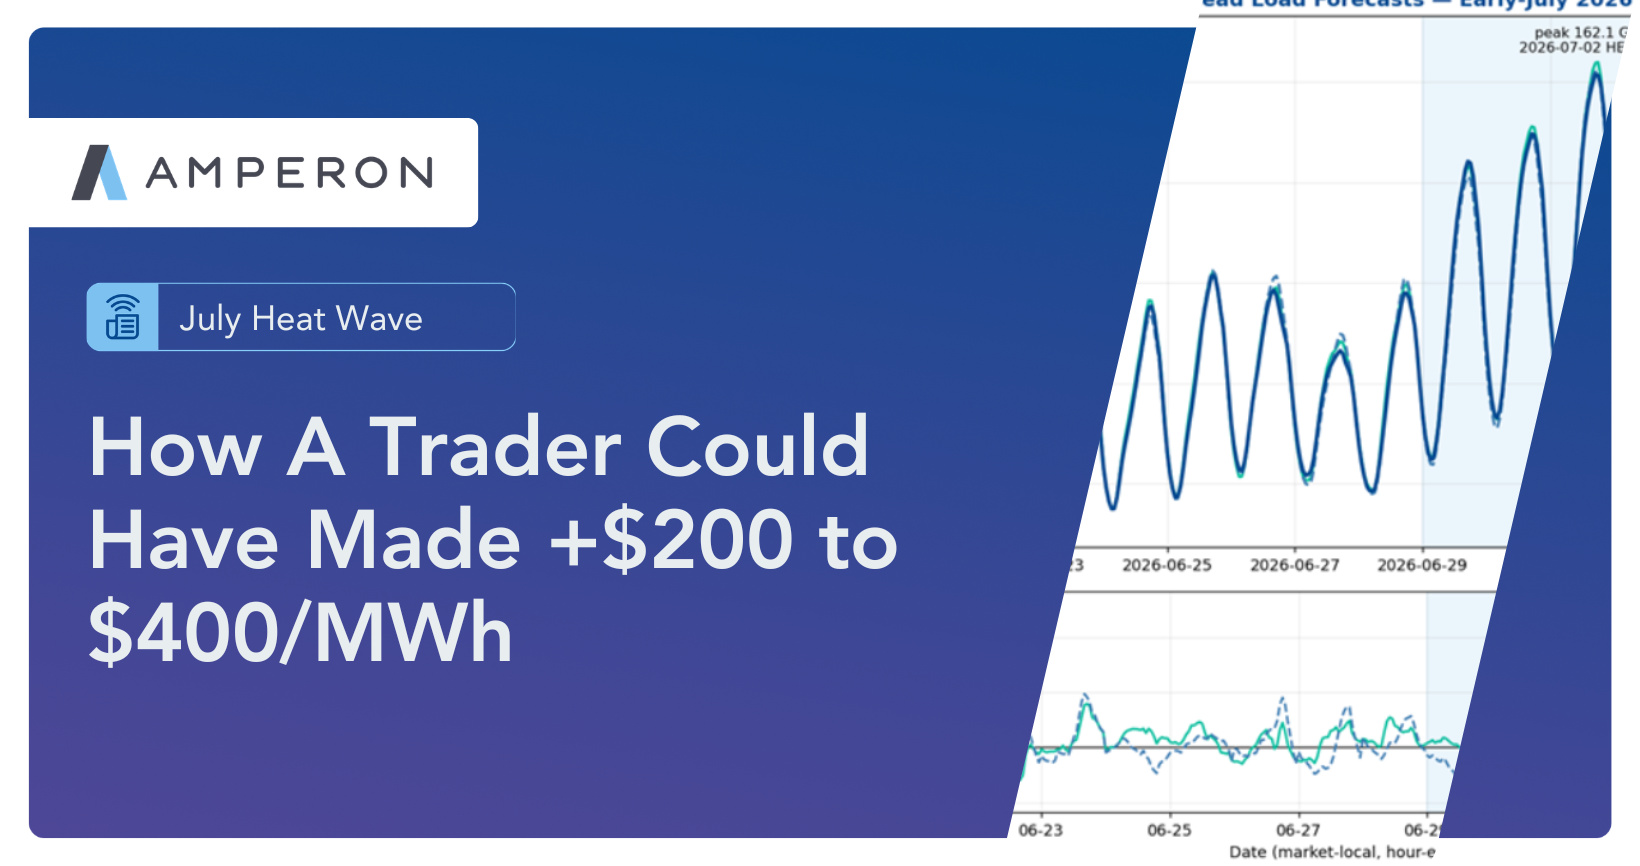
- Summer 2026 set a five-year demand high. PJM's metered peak reached 162.1 GW on July 2, 2026, above the 160.2 GW peak of June 23, 2025. Demand response and curtailments held it down; without them, underlying demand likely topped PJM's 2006 record of about 165.6 GW. Amperon's day-ahead demand forecast error from June 29 to July 3 was 23% lower than PJM's own forecast. See How Amperon performed in the July 2026 heat event.
- Capacity auctions keep clearing at the cap. The 2028/29 auction, held in July 2026, cleared at the $325/MW-day cap across all of PJM and came in 6,831 MW short of the reliability requirement. It was the third straight auction to clear at the cap. The shortfalls started a year earlier, when the 2027/28 auction became the first in which the entire RTO fell short of its reliability requirement. The next auction, for 2029/30, is scheduled for December 2026. See PJM capacity auction explained.
- The load forecast keeps rising. PJM's 2026 long-term forecast puts the summer peak at about 222 GW by 2036, up about 66 GW, or 3.6% a year. Winter peaks are forecast to grow even faster, at 4.0% a year. In 2021, PJM forecast just 0.3% annual growth, with no zone above 0.9%. See Can PJM keep up with load growth?
- Northern Virginia leads the growth. Weather-normalized load in the Dominion zone grew about 6.5% a year from 2021 to 2025, against 1.63% for PJM as a whole. PJM's forecast of data center load in the zone through 2037 rose from about 5,700 MW in 2022 to more than 20,000 MW in 2025. During the July 2026 heat event, Dominion and AEP accounted for 88% of the load that ran above PJM's weather-expected levels. See Why Virginia data centers matter to all of PJM.
- Battery storage is still small. PJM had just over 400 MW of utility-scale batteries online in the third quarter of 2025, compared with about 17.9 GW in ERCOT (April 2026) and 15.8 GW in CAISO (January 2026). A Brattle Group study for the U.S. Energy Storage Coalition found PJM needs at least 16 GW of storage by 2032 to maintain reliability. See Battery Energy Storage: ERCOT vs. CAISO, which includes notes on PJM's lack of commensurate battery buildout.
- Transmission spending is climbing. In 2025, PJM's regional transmission planning process identified 122 new baseline reliability projects, estimated at $11.8 billion, driven mainly by data center growth and electrification.
For the zone-by-zone data behind these figures, download Amperon's PJM Load Growth 2021–2025 report.
How the PJM market works
PJM runs several linked markets. Generators earn money by selling energy, by committing capacity years in advance, and by providing reserves. Buyers pay for each of these, and traders use financial products to buy and sell power and hedge the price differences between zones.
PJM energy markets and LMPs
- Day-ahead market: A financial market that clears the day before the operating day. Buyers and sellers lock in hourly prices and quantities.
- Real-time market: PJM dispatches generation every five minutes to balance supply and demand as it happens. Differences from day-ahead positions settle at real-time prices.
Prices in both markets are set as locational marginal prices (LMPs) at thousands of points on the grid. Each LMP has three parts: the cost of energy, the cost of transmission congestion, and the cost of losses on the lines. When lines are congested, prices on either side of the constraint can split sharply.
PJM caps energy offers at $1,000/MWh, or up to $2,000/MWh for offers backed by verified costs.
The PJM capacity market
PJM's capacity market, the Reliability Pricing Model (RPM), pays generators, batteries, and demand response to be available in a future delivery year.
The main auction, the Base Residual Auction, normally runs about three years ahead of each June-to-May delivery year. Utilities and retailers pay for the capacity their customers need, and those costs flow through to retail bills.
Capacity prices have jumped since 2024. The 2025/26 auction cleared at $269.92/MW-day, up from $28.92/MW-day the year before. FERC then approved a price collar, with a cap of about $325/MW-day and a floor of about $175/MW-day, covering the 2026/27 through 2029/30 auctions.
The last three auctions all cleared at the cap. PJM capacity auction: record pricing and delays explains how the auction works, and PJM capacity price increases and policy responses covers the proposals that followed.
PJM ancillary services
PJM procures regulation services, which keep frequency stable second by second, as well as various reserve products that cover the sudden loss of a large generator or other shortfalls. These markets are small next to energy and capacity.
Source: PJM ancillary services fact sheet.
Financial transmission rights
Financial transmission rights (FTRs) pay their holders the congestion price difference between two points on the grid. Load-serving entities use them to hedge congestion costs, and traders use them to take positions on congestion. PJM congestion costs rose from about $1.8 billion in 2024 to $3.2 billion in 2025. See FTR trading strategies in a changing grid.
PJM states, zones, and trading hubs
PJM covers all or parts of Delaware, Illinois, Indiana, Kentucky, Maryland, Michigan, New Jersey, North Carolina, Ohio, Pennsylvania, Tennessee, Virginia, West Virginia, and Washington, D.C. Within that footprint, PJM has 21 transmission zones, each tied to a local transmission owner.
Source: PJM network service peak loads.
Trading hubs average prices across many nodes to give traders a stable reference price. Western Hub is the most heavily traded PJM price point, and AEP-Dayton Hub and Northern Illinois Hub are also widely used in futures markets.
Prices can differ sharply between zones. The Dominion zone has priced above the PJM average every year since 2021, and the gap has widened. In 2025, Dominion real-time prices averaged $60.65/MWh, 29% above the PJM average of $46.90/MWh. From January to April 2026, they averaged $98.47/MWh, a 40.9% premium, driven by data center load and transmission constraints. Zone-level forecasts show where those splits will happen. See Why Virginia data centers matter to all of PJM.
Who participates in the PJM market
PJM's market includes generators, utilities, retailers, traders, and large energy users. Each faces a different forecasting problem.
See how utilities and retailers use Amperon: Shipley Energy grows its retail electricity business with Amperon's forecasting.
What drives PJM demand and power prices
PJM power prices depend on how much load the grid has to serve, what fuel sets the marginal price, and where transmission limits bind. In 2025, day-ahead prices averaged $47.88/MWh and real-time prices $46.90/MWh across PJM, with much higher prices in constrained zones. Prices rose again in early 2026: from January to April, day-ahead prices averaged $77.76/MWh and real-time prices $69.88/MWh.
Last updated: October 2026
Source: Amperon, PJM Load Growth 2021-2025. 2026 figures cover January through April. Prices spiked across PJM in 2022, when Russia's invasion of Ukraine pushed natural gas prices up.
Data centers and load growth
After years of flat demand, PJM load is growing again. Weather-normalized load grew about 6.5% a year in the Dominion zone from 2021 to 2025, 2.88% in EKPC, and 2.78% in AEP, against 1.63% for PJM overall. Most of that growth is data centers in Northern Virginia, which add flat, around-the-clock load. In the Dominion zone, baseload grew faster than peak demand (an average of 6.60% a year against 5.98%), the pattern data center load produces. Elsewhere, most zones grew about 1% a year or less, and several shrank. Growth is starting to spread: AEP Ohio has contracts with several hyperscale data centers, and in October 2025 Kentucky regulators approved an EKPC tariff for data centers of 15 MW or more. See Why Virginia data centers matter to all of PJM.
Weather and heat
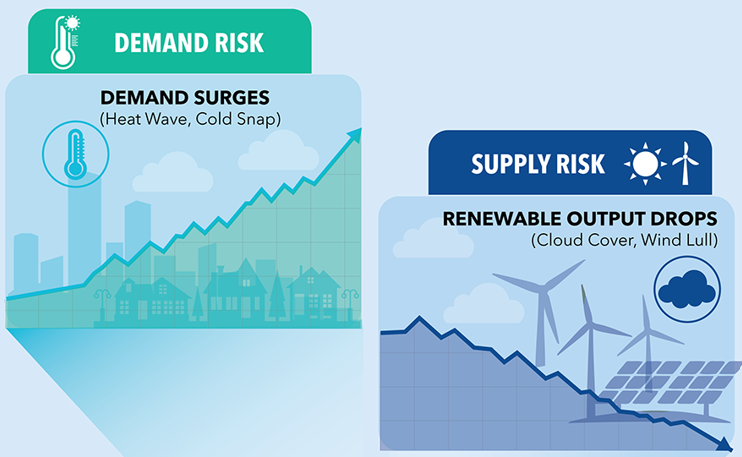
PJM is still summer-peaking, and heat waves set its biggest demand days. In summer, a one-degree rise in temperature moves demand more than a one-degree drop. Winter peaks are climbing too: PJM set a winter record of just under 144 GW on January 22, 2024, and its long-term forecast has winter peaks growing faster than summer peaks. See Can PJM keep up with exponential load growth?
Supply: retirements and a slow queue
Coal and older gas plants are retiring faster than new supply comes online. In 2025, PJM's Reliability Resource Initiative fast-tracked 51 projects totaling more than 9,300 MW. In April 2026, another 811 projects totaling about 220 GW applied to connect under PJM's reformed interconnection process, led by 349 storage projects totaling more than 67 GW. Not all will be built, since permitting and supply chain limits remain. That gap, along with load growth, has pushed capacity prices to the cap.
Electrification and holidays
Electric vehicles and building electrification add smaller but growing load. PJM had about 500,000 light-duty EVs in its footprint in 2024, and S&P Global forecasts about 23 million by 2039. Holidays also matter: when Juneteenth became a federal holiday, many large employers stayed open, so demand fell less than holiday models expected. See PJM heatwave analysis: 90-degree heat and a new federal holiday.
Peak load contributions and coincident peaks in PJM
In PJM, a large customer's capacity and transmission costs are set by its demand during a handful of peak hours from the year before. Cutting load during those hours lowers both charges for the following year.
Capacity costs can be a large share of a big customer's bill, especially since capacity prices reached the cap. A customer that curtails during all five summer peaks can cut its PLC sharply, but no one knows which days will be peaks until the summer is over.
Amperon's Coincident Peak Alerts cover both PJM programs. 5CP alerts flag likely peak days up to seven days ahead, with a probability score that updates as conditions change, so customers can scale curtailment to the risk. Zone-level 1CP forecasts help manage NSPL tags. Explore coincident peak forecasting.
Forecasting in PJM
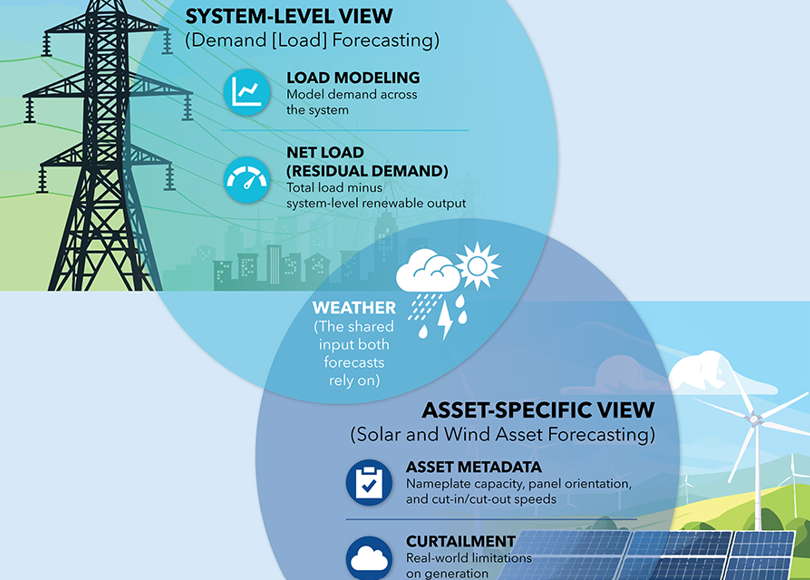
With capacity prices at the cap and load growing faster than PJM's own forecasts predicted, forecast errors in PJM now cost more than they used to. Amperon forecasts PJM demand, net demand, prices, and renewable output at the system and zone level.
Recent results:
- June 2025 heat wave: Seven days before PJM's 160.2 GW peak on June 23, 2025, Amperon forecast 159.8 GW while PJM's forecast sat near 155 GW. Amperon's daily MAPE was 1.13% on June 23 and 0.72% on June 24, compared with 1.48% and 2.09% for PJM's forecast, and Amperon called the peak hour correctly on both days. See PJM breaks 10-year peak load record.
- July 2026 heat event: Amperon's day-ahead error from June 29 to July 3 was 23% lower than PJM's. Its seasonal forecast flagged the risk of a peak near 161 GW on May 19, about six weeks ahead. See How Amperon performed in the July 2026 heat event.
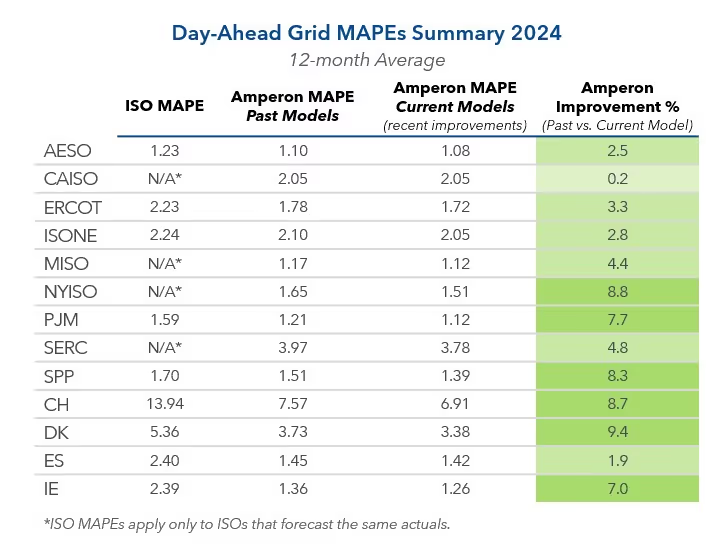
On average, Amperon's PJM grid demand forecasts are roughly 30% more accurate than the grid operator's own forecasts, using trailing 12-month data as of October, 2026.
For seasonal planning and term trading, Amperon's mid-term forecast uses ECMWF ensemble weather models to forecast demand from two weeks to seven months ahead. See Unlocking intelligent term trading and seasonal planning.
Book a demo or request a back-test on your PJM portfolio.
PJM FAQ
What does PJM stand for?
PJM stands for Pennsylvania-New Jersey-Maryland. It began in 1927 as the Pennsylvania-New Jersey Interconnection, a power pool of three utilities, and took the PJM name in 1956 when Baltimore Gas and Electric and General Public Utilities joined. Today it is called PJM Interconnection and covers all or parts of 13 states and Washington, D.C.
What states are in PJM?
PJM covers all or parts of Delaware, Illinois, Indiana, Kentucky, Maryland, Michigan, New Jersey, North Carolina, Ohio, Pennsylvania, Tennessee, Virginia, West Virginia, and Washington, D.C.
How is PJM different from ERCOT?
PJM has a capacity market and operates under FERC oversight across 13 states and D.C. ERCOT is an energy-only market that serves most of Texas, is regulated by the state, and has only limited connections to other grids. Read Amperon's ERCOT market guide.
What are PJM's zones?
PJM has 21 transmission zones, including AEP, ComEd, Dominion, PECO, PPL, and PSEG. Each zone is tied to a local transmission owner and has its own peak load and prices.
What are PJM power prices?
In 2025, PJM day-ahead energy prices averaged $47.88/MWh and real-time prices $46.90/MWh. From January to April 2026, they averaged $77.76/MWh day-ahead and $69.88/MWh real-time. Prices vary widely by zone: the Dominion zone averaged $60.65/MWh in real time in 2025. Customers also pay capacity charges, which are set separately through PJM's capacity auctions.
What is PJM's record peak demand?
PJM's all-time peak is about 165.6 GW, set in 2006. Its highest recent peak was 162.1 GW on July 2, 2026, and demand response held that peak down. Underlying demand was likely higher than in 2006.
What is 5CP in PJM?
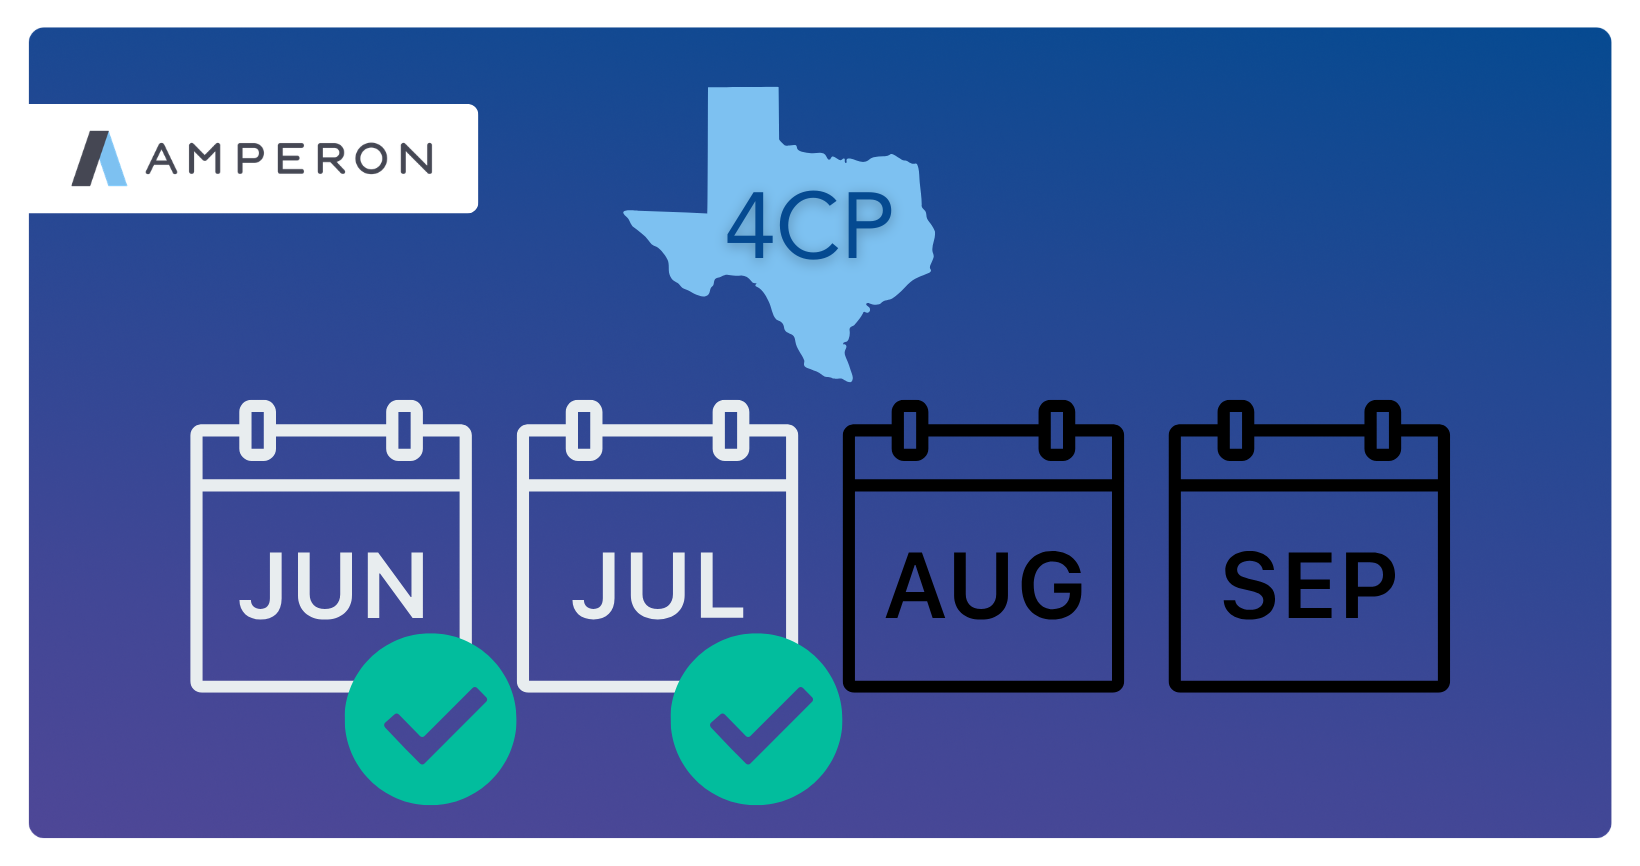
5CP refers to the five highest daily peaks on the PJM system from June through September. A customer's demand during those peaks sets its peak load contribution, which determines its capacity charges for the next delivery year.
How does demand response work in PJM?
Demand response providers commit to cut load when PJM calls on them, and they can be paid through the capacity market for that commitment. Large customers also cut load on their own during likely 5CP days to lower their capacity charges.
Where can I find a PJM load forecast?
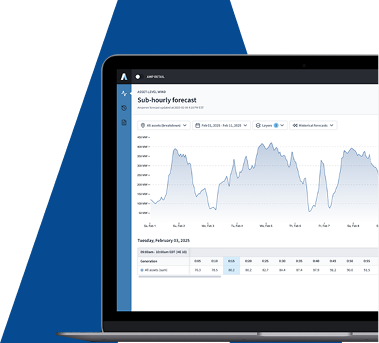
PJM publishes short-term and long-term load forecasts. Amperon offers independent PJM demand, net demand, and price forecasts at the system and zone level, updated sub-hourly. See Amperon's grid forecasting and price forecasting products.
More PJM resources from Amperon
Market design and capacity
- PJM capacity auction: record pricing and delays
- PJM capacity price increases and policy responses
- FTR trading strategies in a changing grid
Load growth and data centers
- Why Virginia data centers matter to all of PJM
- Can PJM keep up with exponential load growth?
- PJM Load Growth 2021–2025: The Demand Behind the Data
Peak load and weather events
- How Amperon performed in the July 2026 heat event
- Summer 2026 in review: record heat, record power demand
- PJM breaks 10-year peak load record, and Amperon saw it coming 7 days out
- PJM heatwave analysis: 90-degree heat and a new federal holiday
Reports and case studies
- Report: PJM Load Growth 2021–2025: The Demand Behind the Data
- Case study: Shipley Energy grows its retail electricity business with Amperon