Product Launch
New Product Alert! Grid Demand Mid-Term Forecasting
Learn More

With Millions On the Line, Amperon Called Cold Snap 33 Days Out

Amperon's Grid Demand Mid-Term Forecast gave power traders a month to act on a $15-25/MWh price move ahead of the December 2, 2025 cold snap in ERCOT.

December 3, 2025

Summary

1
Amperon’s Mid-Term Forecast signaled a tail risk event over a month out.
2
Traders who acted early captured up to $25/MWh in value.
3
AI-driven forecasting advances help translate data and reduce subjectivity.
4

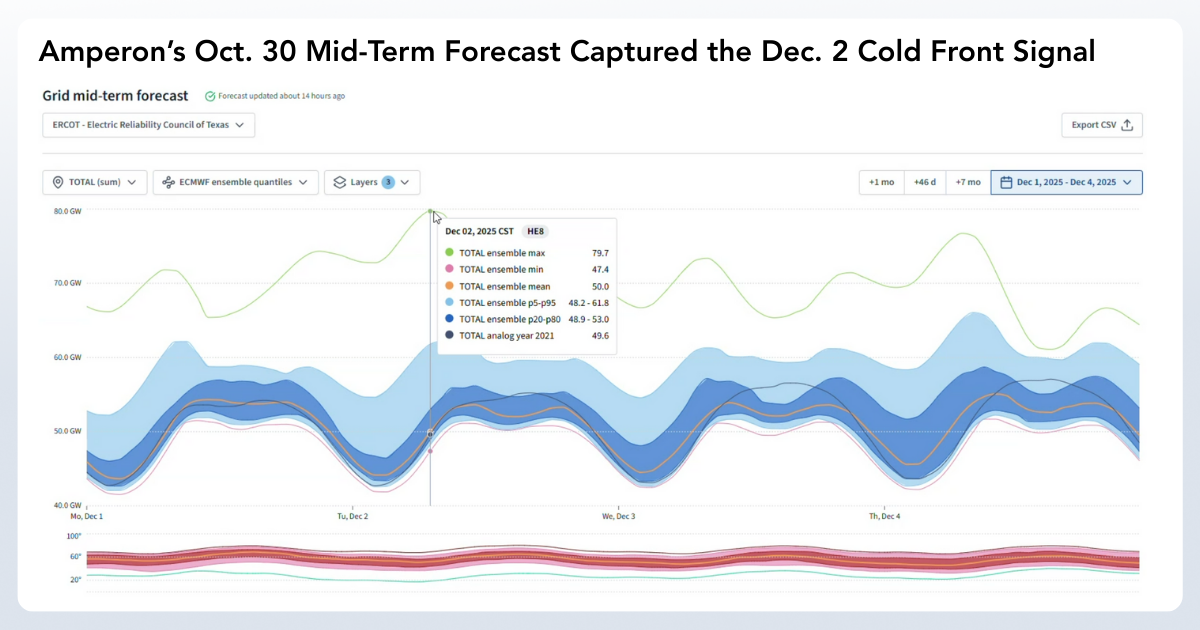
Just before Halloween, Amperon’s new grid-demand Mid-Term Forecast signaled an unusual pattern. Although its median grid demand forecast remained steady, its high-side prediction hinted at a more menacing possibility on the horizon.

The model indicated Texas’ grid could reach a peak demand of 61.8 GW on December 2—over 20% higher than the roughly 50 GW system baseline for early December. Normally, many traders would ignore this type of improbable outcome, especially when trying to interpret weather models more than a month out.

33 days later, the December 2 peak reached 62.2 GW. “Tail risk” had reared its ugly head.

Amperon Grid Demand MTF Screenshot from October 30
On Oct. 30, Amperon’s p95 MTF ensemble forecasted a Dec. 2 ERCOT peak demand of 61.8 GW.

Tail Risk Matters

Tail risk is the idea that improbable events can occur. In power markets, if traders and risk managers have not hedged accordingly, they could be left exposed to massive costs (or miss out on major opportunities).

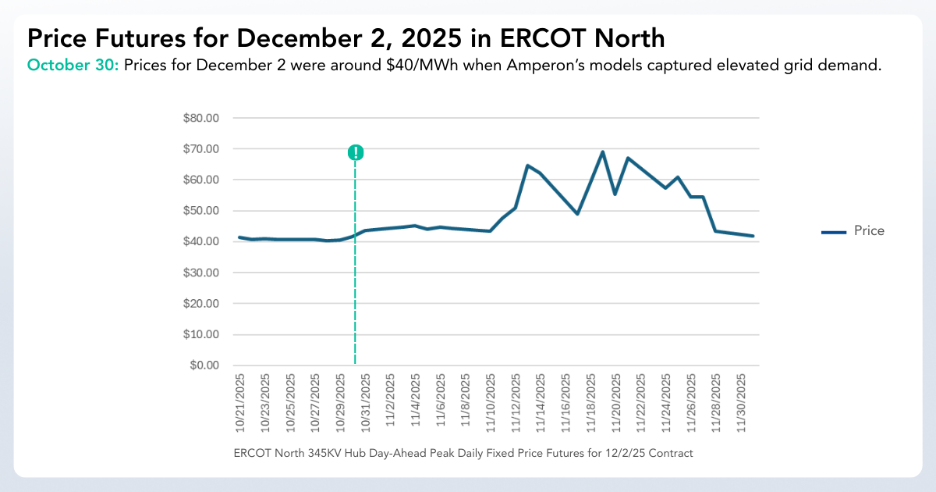
In this case, those who saw the December 2 signal and acted early captured roughly $15-25/MWh in value. For context, average power prices in ERCOT range from $35-40/MWh this time of year, so even a $15 delta represents a 40% change, potentially adding up to millions in avoided exposure—or arbitrage opportunity.

ERCOT North price futures for December 2, 2025
A trader who bought Dec. 2 ERCOT North day-ahead price futures on Oct. 31 and sold on Nov. 19 would have captured roughly $25/MWh in value.

Artificial Intelligence is often described as a major challenge to power systems, but this real example shows the power of AI to improve grid efficiency and operator profitability.

Tracking the Polar Vortex Breakdown

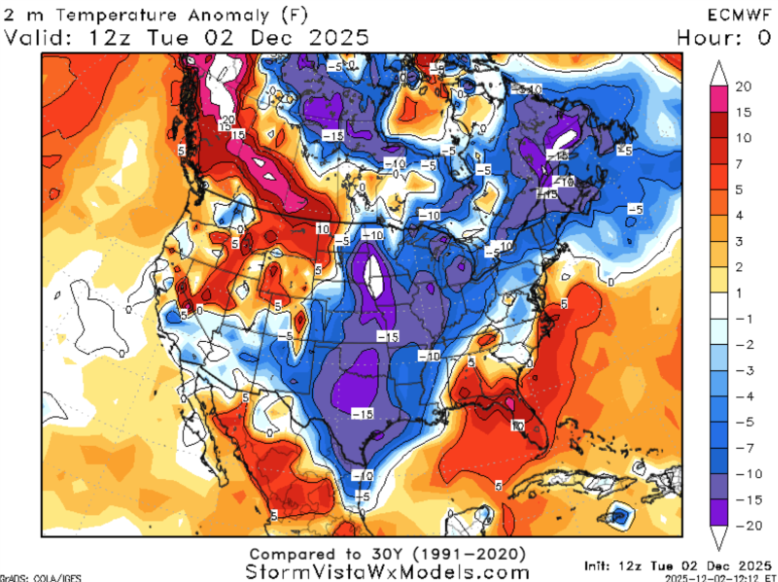
The term “polar vortex” has forced itself into kitchen table conversations in recent years. Many understand it to mean a cold snap. In fact, the polar vortex is a large low-pressure area constantly swirling over the Earth’s poles. It's when the polar vortex breaks down that temperate regions get hit with arctic blasts.

When the northern polar vortex is disrupted, arctic blasts can reach as far south as Texas, as in 2021's infamous Winter Storm Uri. This time, a blast of frigid air surged into parts of Texas and all across the eastern US, triggering freezing temperatures from Dallas to Boston.

December 2, 2025 US weather map
Dec. 2 temperatures were 5 to 15 degrees below normal across much of the central and eastern US. Some areas like northern Texas were up to 20 degrees below normal.
Eliminating Mental Math and Gut Calls

Not only did Amperon’s Mid-Term Forecast users receive the storm signal a month out, but they eliminated a time-consuming and historically subjective step: translating weather data into grid demand. Term traders are always watching weather models like the ECMWF, then they traditionally rely on their experience and intuition to extrapolate grid impacts and make “gut calls” on their market positions.

Amperon’s industry-first weather-informed grid-demand MTF dynamically translates 6-hour weather model updates into an hourly grid demand forecast up to 7 months out. Some have been skeptical of this forecast, and to be sure, it is an imperfect science. But advances in both weather models and forecasting methodologies have made it possible to glean important signals from the noise.

This is not the first time Amperon’s MTF signaled surprising events more than a month out. It saw ERCOT’s 2024 MLK Weekend arctic blast 38 days out and PJM’s early-summer heat wave 32 days in advance. In fact, between January 2024 and July 2025, it successfully predicted 67 out of 68 top 1% load events across all PJM, ERCOT, and ISO-NE zones up to four weeks in advance.  

Thriving Under Volatility

This early-season arctic blast proves the extremes matter, even though this winter appears mild on average. Tail risk is real—and thanks to recent advances in forecasting methodology, utilities and other market participants can now see a full picture of possible outcomes 30+ days in advance.  

Extreme weather events are reshaping power markets, and traditional mid-term forecasts have limited accuracy in the face of changing patterns. And while AI may be adding further complexity by driving formidable new load growth, it’s also saving companies millions by helping them see and plan for a volatile future.  

As of December 2, the p95 ensemble in Amperon’s Mid-Term Forecast is signaling another US cooldown the week of Christmas. The time to capture value is now. Contact us to discuss your options.

AI-driven Forecasting

Our advanced machine learning methodology delivers the accuracy you need to optimize operations and maximize profits.

  • 40K weather points from 4 vendors
  • 15-day short-term forecasts that update sub-hourly
  • Globally available
  • Leading UI/UX or API delivery
Book a demo

Want 3x more accurate forecasts? Let's talk.

Book a demo

Related articles

Left arrow icon for navigationRight arrow icon for navigation
Blog
December 3, 2025
With Millions On the Line, Amperon Called Cold Snap 33 Days Out
Open article
Blog
December 2, 2025
Chilean Solar and Wind Asset Owners Face Hourly Reporting Under New Market Structure
Open article
Blog
November 19, 2025
Can PJM Keep Up with Exponential Load Growth?
Open article
Blog
November 19, 2025
US Winter Weather Outlook 2025–2026: Mild on Paper, Volatile in Practice
Open article
Blog
November 18, 2025
Ontario’s Day-Ahead Market is a Renewables Profitability Test
Open article
Blog
November 18, 2025
US Solar and Wind Curtailment Is Exploding
Open article
Blog
October 6, 2025
Navigating the RTC+B Paradigm Shift
Open article
Case study banner reading “Nailing MISO’s Fall 2025 Coincident Peak” with a computer displaying grid demand forecasts
Blog
November 18, 2025
Nailing MISO's Fall 2025 Coincident Peak: A Week-Ahead Perfect Call
Open article
Amperon MTF model visualization displaying market trends and forecasts
Blog
November 18, 2025
Unlocking Intelligent Term Trading and Seasonal Planning  
Open article
Blog post header with palm tree in hurricane winds asking Why Has This Hurricane Season Been So Quiet with Amperon branding
Blog
November 18, 2025
Why Has This Hurricane Season Been So Quiet?
Open article
Table showing parallel flow congestion scenarios across different energy markets including ISO/RTO, WEIM, WEIS, Markets+, and EDAM with scheduled delivery systems and mitigation strategies
Blog
November 18, 2025
CAISO Breaks the Transmission Hedge
Open article
Amperon blog post graphic asking High ERCOT Demand, Low Wind, and No Price Spike? with load forecast chart for August 18, 2025
Blog
November 18, 2025
High ERCOT Demand, Low Wind, and No Price Spike?
Open article
ISONE May hourly average load comparison chart showing data from 2023, 2024, and 2025 with peak loads around 13,534 MW at HE17-18
Blog
November 18, 2025
Electrification and BTM Solar: Reshaping Demand in ISO New England
Open article
Line graph showing MISO Net Load from 2022-2025 comparing hourly load patterns ranging from 50,000 to 90,000 MW across 24-hour period
Blog
November 18, 2025
The Rise of the Duck Curve in ERCOT: A Shift in Net Demand Peak and the Future of Solar Power Integration
Open article
Amperon market analysis titled Where's the Chaos? ERCOT's Surprisingly Quiet Summer with curved line graph showing peak demand trends from 2022-2025
Blog
November 18, 2025
Where’s the Chaos? ERCOT’s Surprisingly Quiet Summer
Open article
Amperon forecasted load versus prediction time by weather vendor chart for PJM on June 24, 2025, showing settled demand at 158.2 GW with multiple vendor forecasts (ENS_1, NBM, DTN, AG2)
Blog
November 18, 2025
PJM Breaks 10-Year Peak Load Record — and Amperon Saw It Coming 7 Days Out
Open article
Blog
June 18, 2025
PJM Forecast: June 23–25 Heat Wave May Shatter Summer Expectations
Open article
Blog
June 11, 2025
ISONE’s First Heat Spike of Summer- and Amperon Nailed It
Open article
Amperon whitepaper cover titled Cost of Uncertainty: The Challenges and Value of Accurate Price Forecasting with download button, dated March 2025
Blog
November 18, 2025
Why Wholesale Electricity Prices are ESPECIALLY Volatile in Texas
Open article
Blog
June 3, 2025
Powering Profitable Growth for Retail Electricity Providers: Turn Load Forecasting into Your Competitive Edge
Open article
Blog
November 18, 2025
Navigating ERCOT’s 4CP Program: Key Updates and Strategic Preparation for 2025
Open article
Amperon promotional banner announcing sub-hourly grid forecasts for European TSOs now available, featuring transmission tower with geometric orange and blue design elements
Blog
November 18, 2025
Europe’s Shift to 15-Minute Power Markets: How Amperon Helps You Prepare for Market Evolution
Open article
Amperon blog post graphic titled "The Shape Shift: How Texas Net Demand Transitions from Shoulder to Summer" with wind turbine image
Blog
November 18, 2025
The Shape Shift: How Texas Net Demand Transitions from Shoulder to Summer
Open article
Amperon presentation slide titled "ERCOT's Evolving Price Dynamics 2021-2024 Analysis" with sunset transmission tower image
Blog
November 18, 2025
ERCOT’s Evolving Price Dynamics [2021-2024 Analysis]
Open article
A promotional image announcing the introduction of real-time grid price forecasts now live in ERCOT, featuring Amperon branding
Blog
November 18, 2025
Amperon Expands Forecasting Capabilities with Real-Time Price Predictions in ERCOT
Open article
Blog
November 18, 2025
MISO’s VOLL Change Could Reshape Scarcity Pricing and Reliability Signals
Open article
Blog
November 18, 2025
Why Behind-the-meter Solar Complicates Spring Forecasting
Open article
Comparison table showing solar and wind forecasting capabilities across Machine Learning, Physics-based, and Amperon (ML+PB) approaches for partial asset metadata, soiling, equipment degradation, biased weather, and curtailment
Blog
November 18, 2025
How to Forecast Energy Generation for Wind or Solar Assets
Open article
Day-ahead grid MAPE summary table for 2024 showing 12-month average comparison of ISO MAPE, Amperon MAPE past models, current models, and improvement percentages across multiple ISOs (AESO, CAISO, ERCOT, ISONE, MISO, NYISO, PJM, SERC, SPP, CH, DK, ES, IE)
Blog
November 18, 2025
Always Innovating: Amperon’s New Techniques to Improve Energy Forecasting
Open article
Amperon recap slide for April 7 titled "Why prices in ERCOT soared to $4000 per MW" with pastoral field landscape at golden hour
Blog
November 18, 2025
High Net Demand and Outages Caused Recent Price Spike in ERCOT
Open article
Amperon ebook promotional banner "Price Forecasting: Cost of Uncertainty - The Challenges and Value of Accurate Price Forecasting" with free ebook download button on gradient blue-green background
Blog
November 18, 2025
Are ERCOT’s morning ramp DA prices really higher than summer?
Open article
Infographic titled "Types of Data Relevant to Both Solar and Wind Assets" showing three categories: Nameplate Capacity, Location of Asset, and Historic Curtailment with wind turbines and solar panels imagery
Blog
November 18, 2025
Inside our Data: Intro to Renewable Asset Data
Open article
Amperon promotional slide "Adapting to OMIE's 15-Minute Transition: How Granular Forecasts Can Help You Stay Ahead" with laptop showing asset-level solar sub-hourly forecast for January 12, 2025
Blog
November 18, 2025
Adapting to OMIE’s (Portugal and Spain) 15-Minute Transition: How Granular Forecasts Can Help You Stay Ahead
Open article
Blog
November 18, 2025
What the beginning of daylight savings time means for peak pricing
Open article
Amperon presentation slide "How the Grid Changed in 2024" with aerial view of large-scale solar farm installation in agricultural setting at sunset
Blog
November 18, 2025
How the Grid Changed in 2024
Open article
Amperon recap slide for February 14-20 titled "Another cold week on the grid, another good week for Amperon's demand forecasts" with wind turbines in snowy landscape
Blog
November 18, 2025
Another cold week on the grid, another good week for Amperon’s demand forecasts
Open article
Blog
November 18, 2025
The Future of Western Power Markets: Why Implementing a Day-Ahead Market Matters
Open article
Blog
November 18, 2025
Harnessing the power of sub-hourly and hourly forecasts for wind assets
Open article
Blog
November 18, 2025
Forecasting for the Super Bowl: How much does the big game really affect demand?
Open article
Amperon promotional banner stating "33% more accurate in MISO" with blue gradient background and solar panels with wind turbines imagery
Blog
November 18, 2025
Best Demand and Net Demand Forecasting Calls to End 2024
Open article
Amperon slide featuring Punxsutawney Phil prediction reference titled "What Punxsutawney Phil's prediction for 6 more weeks of winter really means for the grid" with snowy groundhog image
Blog
November 18, 2025
What Punxsutawney Phil’s prediction for 6 more weeks of winter really means for the grid
Open article
Blog promotional graphic on navy background titled "New Blog: Why a hybrid regression/ML approach outperforms in energy forecasting" with layered visualization showing Linear Regression, Boosted Trees, and Additional secondary models
Blog
November 18, 2025
Why a hybrid regression/ML approach outperforms in energy forecasting
Open article
Blog
June 3, 2025
Europe 2024 Best Amperon Forecasting Calls and Trends to Watch
Open article
Title slide reading "Part 1: Inside Our Data: The Importance of Granular Weather Data" by Lily Bowdler from Amperon
Blog
November 18, 2025
Inside our Data: The Importance of Granular Weather Data
Open article
Bar chart showing 2025 Highest ISO Demand Levels So Far across four ISOs: ERCOT (68.9 GW), PJM (126.8 GW), MISO (97.9 GW), and SPP (43.1 GW)
Blog
November 18, 2025
Déjà vu? With one cold snap down, will we have a repeat of last MLK weekend?
Open article
Blog promotional slide "The first winter cold snap is here, but will it break records?" with laptop displaying PJM weather data showing 5-year, 10-year, and 30-year normals for various cities
Blog
November 18, 2025
First winter cold snap is here, but will it break records?
Open article
Blog
June 3, 2025
Looking Back (and Ahead): A Year-end Q&A with Amperon CEO Sean Kelly
Open article
Line graph comparing Ireland Wind Generation forecasts for August 20-26, showing Actual Wind, Amperon Day Ahead Wind Forecast, and EirGrid Day Ahead Wind Forecast (duplicate of image 43)
Blog
November 18, 2025
How strong winds in Ireland left power market stakeholders exposed
Open article
Line graph of CAISO demand for Indigenous Peoples Day 2024 (October 11-14), showing Duck Curve pattern and comparing Amperon Day Ahead, ISO Day Ahead, and Actuals
Blog
November 18, 2025
Forecasting for the holidays: How holidays affect demand patterns
Open article
Blog
June 3, 2025
When tech buys nuclear, who wins?
Open article
Blog
November 18, 2025
Unlocking new standards in solar forecasting to maximize asset efficiency
Open article
Marketing graphic titled "What's Happening with Price Forecasting? A Q&A with Amperon CEO Sean Kelly" featuring professional headshot of Sean Kelly
Blog
November 18, 2025
What’s Happening with Price Forecasting? A Q&A with Amperon CEO Sean Kelly
Open article
Blog
November 18, 2025
Taking Advantage of Amperon’s Net Demand Forecast on Snowflake
Open article
Line graph showing ES (Spain) Demand for August 15 Feast of Assumption, with table comparing Peak Demand, Amperon APE, and ES APE percentages across four dates, plus lower panel showing electricity production and spot prices
Blog
November 18, 2025
2024 Energy Demand Trends: What Happened During 3 Recent EU Holidays
Open article
Blog
June 3, 2025
PJM Capacity Auction: Record Pricing and Delays
Open article
Multi-panel visualization showing ERCOT Demand for July 1-5, including line graphs comparing Amperon and ERCOT forecasts, data tables showing MAPE percentages for different dates, and gauge charts showing average MAPE (1.02% AMP, 1.69% ISO)
Blog
November 18, 2025
Amperon’s best energy forecasting calls for Summer 2024
Open article
Marketing text overlay on transmission tower background stating "Amperon's new price forecast tackles ERCOT's volatility and helps market participants mitigate risks"
Blog
November 18, 2025
Amperon’s new price forecast tackles ERCOT’s volatility and helps market participants mitigate risks
Open article
Marketing graphic announcing "Expanding Amperon's coverage on Snowflake" for Demand and Net Demand across North America and Europe ISO/TSOs, featuring screenshot of Snowflake marketplace interface
Blog
November 18, 2025
Expanding Amperon’s coverage on Snowflake: Demand and Net Demand for North America and Europe ISO/TSOs
Open article
Video thumbnail from webinar titled "Powering Data-Driven Decisions: Enhance Your Energy Trading Game with Amperon + Snowflake" featuring Amperon and Snowflake logos, dated September 26, 2024, with transmission tower image and video progress indicator show
Blog
November 18, 2025
Powering Data-Driven Decisions: Enhance your energy trading game with Amperon & Snowflake
Open article
Photograph of single wind turbine on hilltop with autumn-colored foliage in foreground against clear blue sky
Blog
November 18, 2025
Analysis of spring curtailments in preparation for fall
Open article
Marketing graphic announcing "Introducing Asset-Level Wind Short-Term Forecasts" with photograph of wind turbines against mountain landscape backdrop
Blog
November 18, 2025
Expanding generation forecast capabilities into wind
Open article
ERCOT West Zone Net Demand Short-Term Forecast for August 11-13, 2024, showing three stacked area graphs for Net Demand, Solar Generation, and Wind Generation, with explanatory text about negative net load, curtailments, and congestion implications
Blog
November 18, 2025
Granular insights from grid net demand forecasts: Importance of zone-level forecasting
Open article
Blog
December 2, 2025
Why solar forecasts and accuracy metrics are a big deal
Open article
Satellite view from space showing large hurricane system with visible eye wall approaching Caribbean islands, showing Earth's curvature against black space background
Blog
November 18, 2025
Weaker hurricane season due to Saharan dust
Open article
Close-up photograph of solar panel array showing dust, dirt, and debris accumulation on photovoltaic panel surfaces, demonstrating need for maintenance
Blog
November 18, 2025
Hailstorms: How they can impact your solar farm
Open article
Nighttime satellite image showing hurricane system with well-defined spiral structure making landfall on southeastern United States coastline with visible city lights
Blog
November 18, 2025
Forecasting for SERC During Tropical Storm Debby
Open article
Photograph of dark chalkboard filled with mathematical equations, formulas, and diagrams including algebraic expressions, chemical structures, geometric drawings, and calculus notations written in white chalk
Blog
November 18, 2025
The different kinds of forecasting metrics
Open article
Blog
November 18, 2025
Amperon’s industry-leading forecasts now available to transact on the Microsoft Azure Marketplace
Open article
Aerial photograph of wind farm installation with three large white wind turbines on rolling green hills with mountains in background and scattered buildings in rural landscape
Blog
November 18, 2025
Reminiscing on the summer’s heat waves... so far
Open article
Marketing graphic announcing "Introducing Solar Sub-Hourly Generation Forecasts" with photograph of solar panel installation on ground-mounted framework in grassy field
Blog
November 18, 2025
Harnessing sub-hourly solar forecasts for power markets trading
Open article
Blog
November 18, 2025
Amperon’s methodologies: AI-powered forecasting for the energy transition
Open article
Blog
June 3, 2025
The Double-Edged Sword: Using LLMs in Electricity Market Forecasting
Open article
Satellite image of two tropical cyclone systems near Asian coastline showing clear hurricane eyes and spiral cloud formations over ocean waters with land mass visible on left side
Blog
November 18, 2025
Advanced stress testing for extreme weather
Open article
Blog
June 3, 2025
Enabling Amperon’s short-term grid forecast with Snowflake
Open article
Upward angle photograph of tall electrical transmission tower structure against blue sky with white clouds, showing multiple levels of power line connections and lattice framework construction
Blog
November 18, 2025
Amperon’s best forecasting calls this Spring
Open article
PJM heat wave peak demand forecast comparison table showing Amperon APE vs PJM APE for June 18-23
Blog
November 18, 2025
PJM Heatwave Analysis: Forecasting for 90-degree heat and a new federal holiday
Open article
Seattle city skyline at night featuring the Space Needle with illuminated buildings
Blog
November 18, 2025
A deep dive into what happened MLK weekend in the Pacific Northwest and West Coast
Open article
30-year temperature normals table showing forecasts for cities from Newark to Rockford, June 12-26
Blog
November 18, 2025
June 2024 heat wave - PJM
Open article
Houston demand chart showing May 16 power outage affecting 1 million people with Amperon's weather actuals vs actual load
Blog
November 18, 2025
Storm Analysis: ERCOT’s intense may weather
Open article
Amperon blog header image asking "What is the true carbon impact of your renewable assets?" with solar panels and wind turbines
Blog
November 18, 2025
What is the true carbon impact of your renewable assets?
Open article
White electric fan with yellow and blue ribbons blowing against bright yellow background
Blog
November 18, 2025
Record summer heat is coming, is the grid – and your company – prepared?
Open article
Blog
June 3, 2025
The Western Interconnection’s big day-ahead decision
Open article
Amperon promotional banner introducing Ensemble Forecast and Advanced Weather Package with laptop display
Blog
November 18, 2025
Introducing Amperon's Ensemble Forecast, NBM Integration, and Advanced Weather Package
Open article
Aerial view of large-scale solar panel farm with organized rows in rural landscape
Blog
November 18, 2025
Coincident peak season is coming
Open article
Desert landscape with red sand, sparse vegetation, and blue cloudy sky
Blog
November 18, 2025
WRAP: New forecasting requirements for Western states’ resource adequacy coalition
Open article
Magnifying glass on business charts and graphs with eyeglasses, representing data analysis
Blog
November 18, 2025
Amperon’s 6 best forecasting calls in 2024 so far
Open article
Power transmission towers and lines crossing snow-covered winter landscape under blue sky
Blog
November 18, 2025
How stable is our grid?
Open article
Total solar eclipse showing sun's corona around dark moon disc against black sky
Blog
November 18, 2025
How the solar eclipse will affect grid stability
Open article
Blue ethernet cable with US hundred dollar bills representing energy cost savings and electricity pricing
Blog
November 18, 2025
The economics of the clean energy transition
Open article
Blog
June 3, 2025
How weather impacts energy demand & prices
Open article
Groundhog (marmot) standing on snow looking alert, associated with weather prediction tradition
Blog
November 18, 2025
How Punxsutawney Phil’s predictions affect the energy grid
Open article
Blog
November 18, 2025
Navigating error measurements for wind and solar generation - the case for cnMAE
Open article
Blog
June 3, 2025
Unlocking solar generation insights with Amperon's renewable forecasts
Open article
Blog
June 3, 2025
Amperon's 2023 Recap
Open article
Blog
June 3, 2025
Morning Ramp Ups and Weather Misses: ERCOT Winter Storm Recap
Open article
Blog
June 3, 2025
Cold Winter Storm Could Bring Trouble to ERCOT
Open article
Blog
June 3, 2025
The Duck Curve and Utilities’ Emerging Seasonal Risks
Open article
Blog
June 3, 2025
Why Advanced Forecasting is Needed for a Solar Powered Future
Open article
Blog
June 3, 2025
Amperon Launches in SERC
Open article
Blog
June 3, 2025
Amperon’s net demand and renewable forecasts are now in CAISO
Open article