

ERCOT
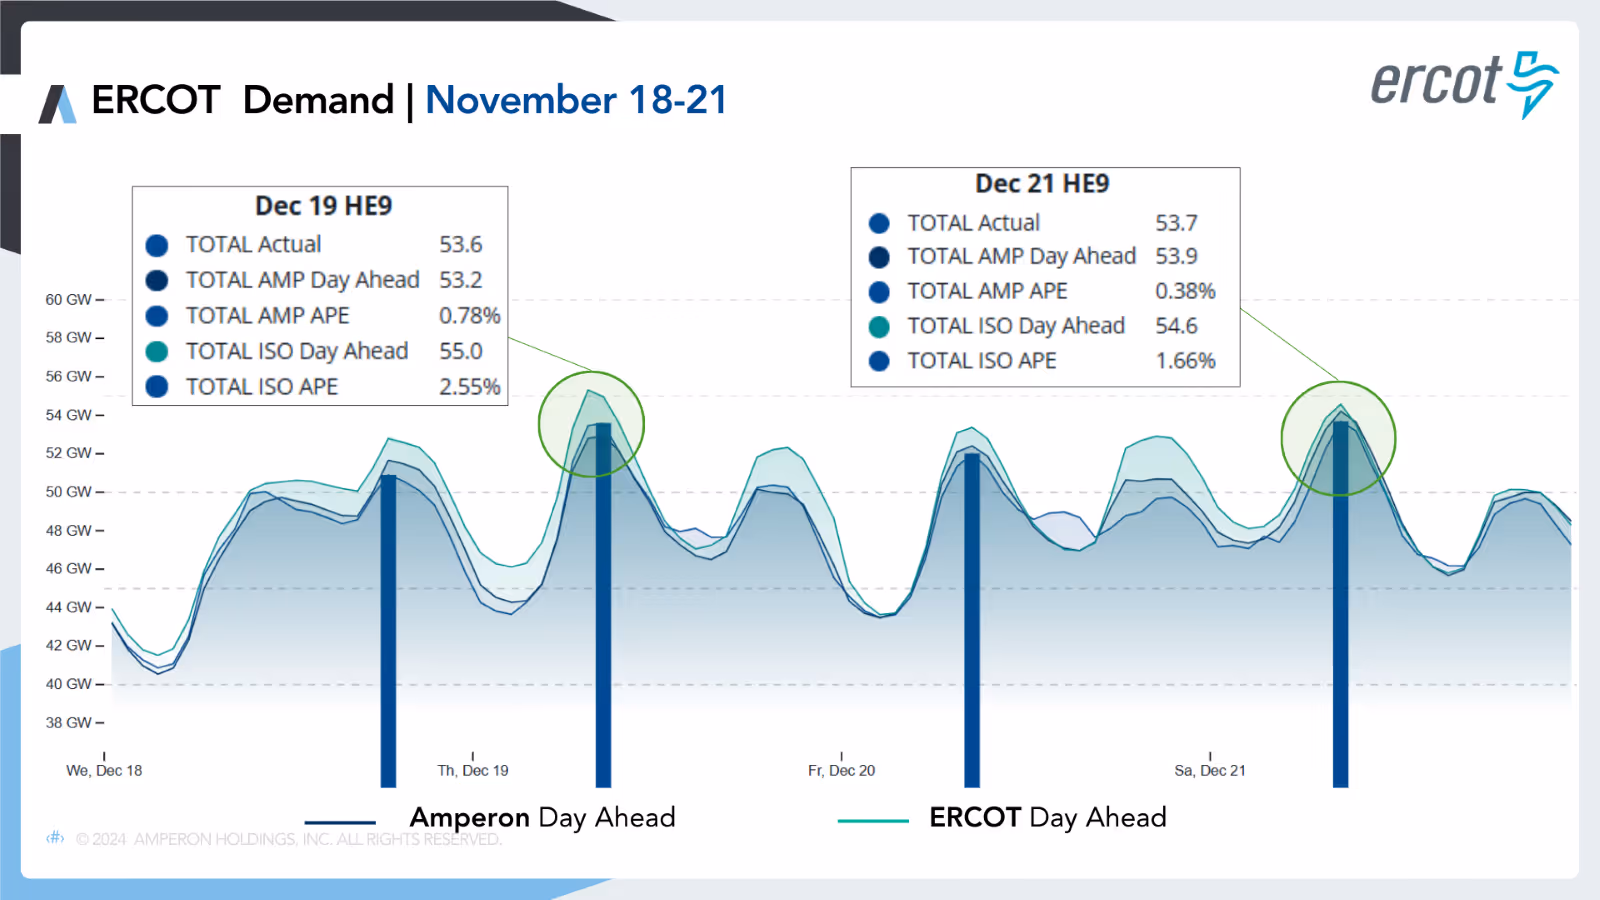
December 18-21
Demand
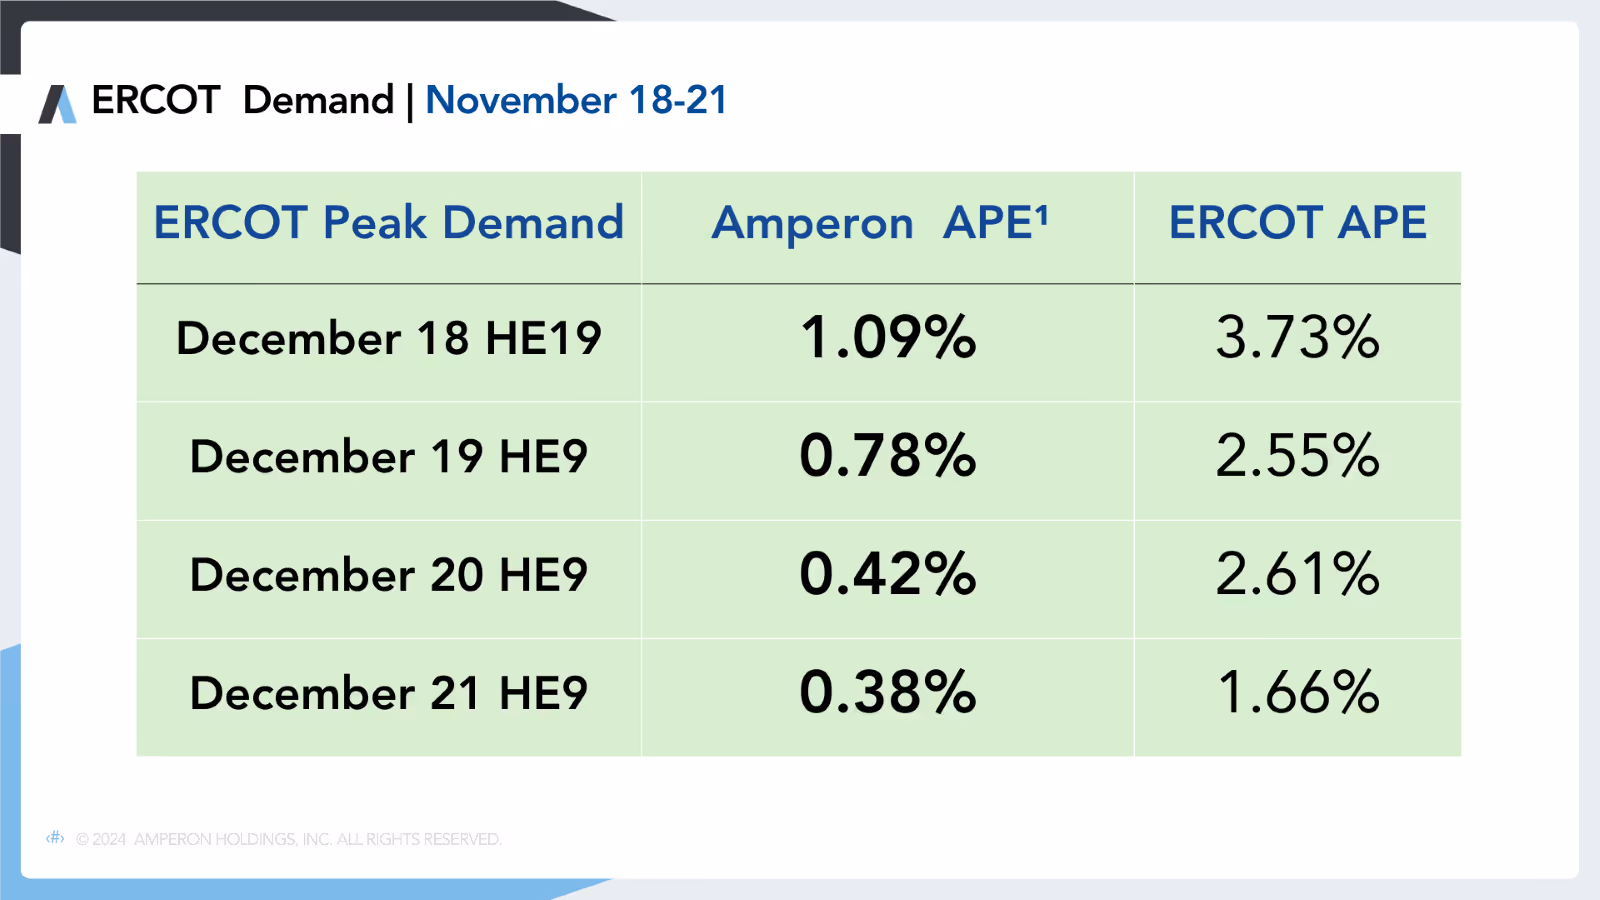
Morning temperatures averaged as low as 39°F, with some ERCOT regions experiencing even cooler conditions. ERCOT consistently overestimated demand almost every day during this period.
Across these days, Amperon's average MAPE was 50.02% more accurate than ERCOT's MAPE. During the peak demand hours on these days, Amperon's forecast was 47.49% more accurate on average compared to ERCOT's.
Price Impact
During peak demand periods, DARTs remained consistently positive across the region, likely influenced by ERCOT's tendency to overestimate demand, which contributed to weaker real-time prices.
Despite the frigid temperatures, regional prices during the coldest hours hovered around $30, showcasing market stability. Amperon's forecast accurately anticipated lower-than-expected demand, offering valuable insights that was a factor resulting in weaker real-time prices.
ERCOT
November 2-5
Demand
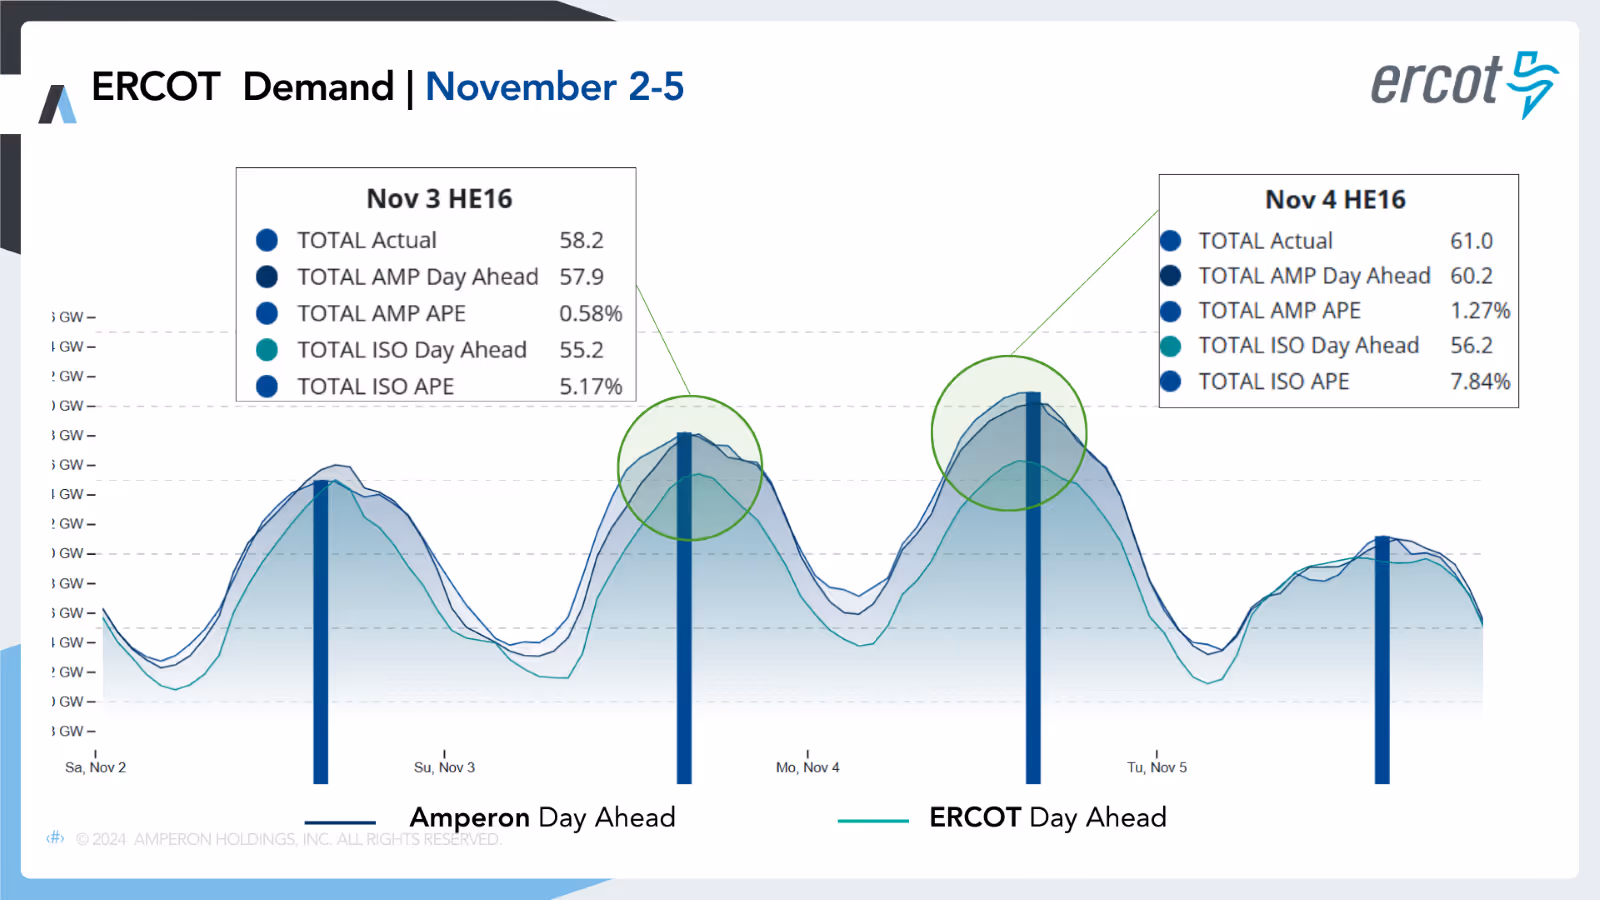
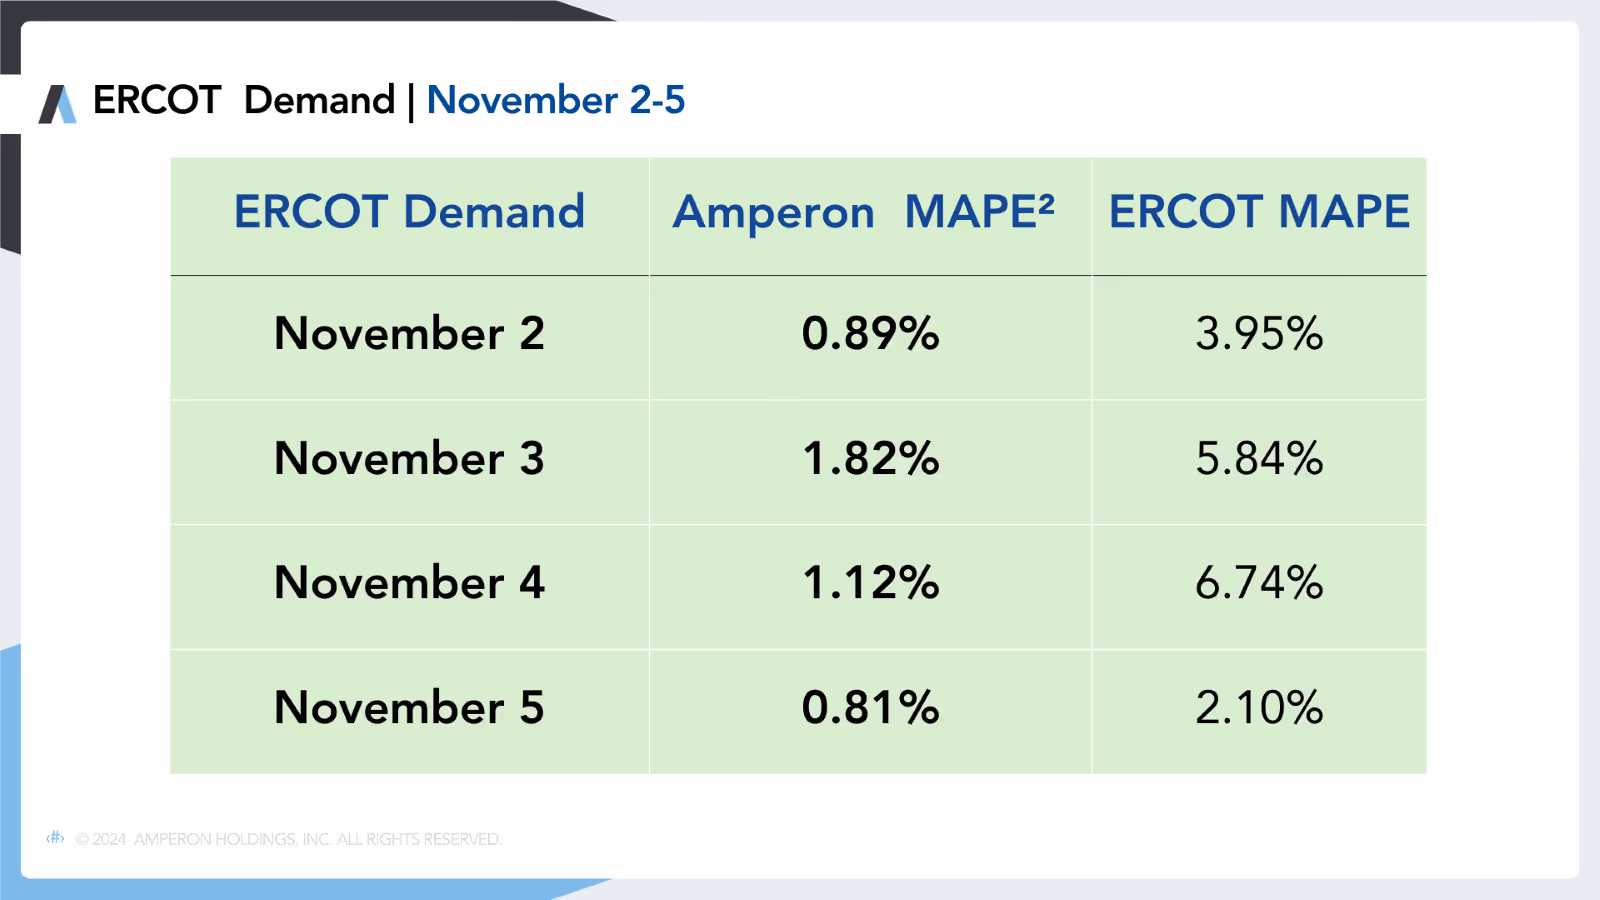
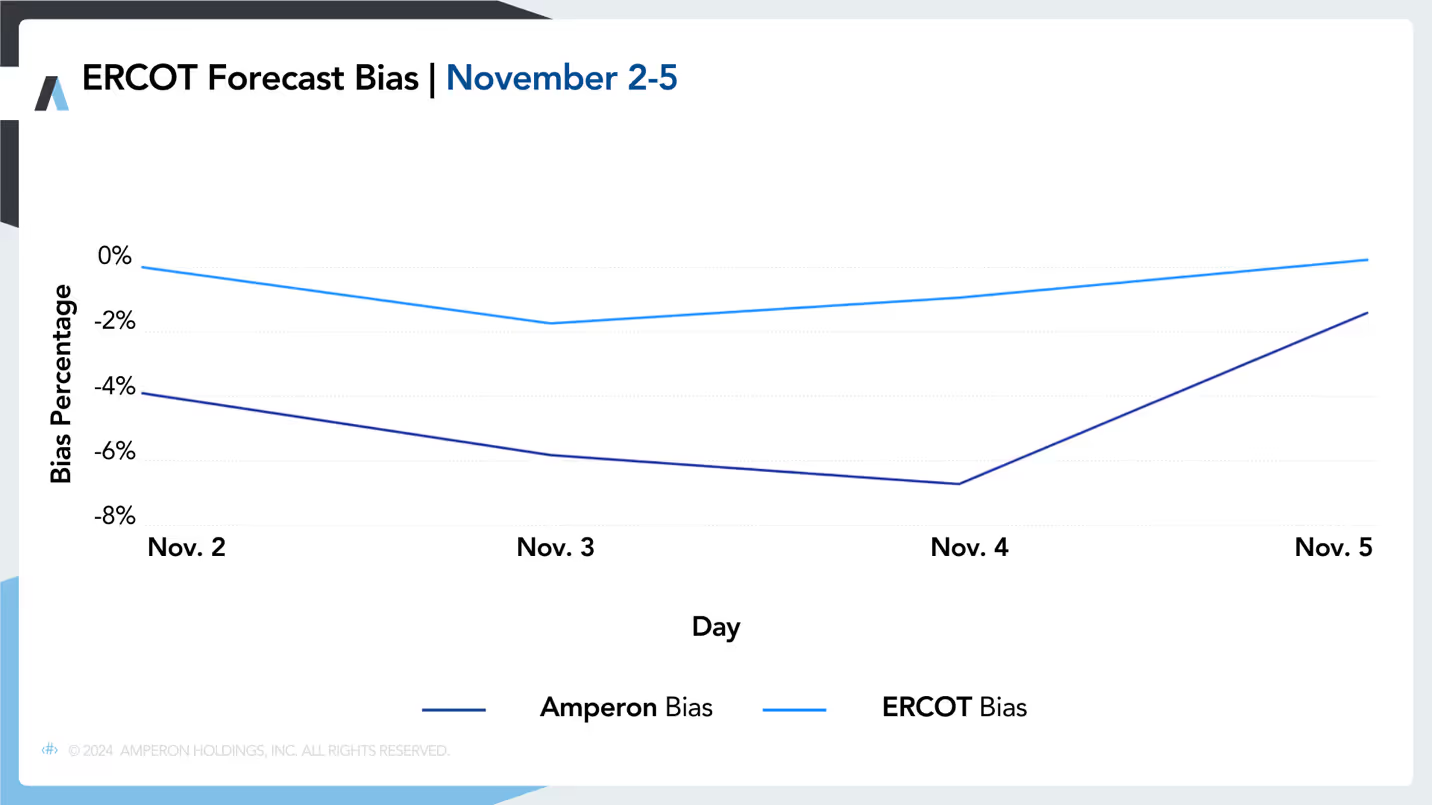
During this period, ERCOT significantly under-forecasted demand, particularly during peak demand hours. Our average MAPE for these days was 74.68% more accurate than ERCOT's. While ERCOT typically has a positive forecast bias, consistently overestimating demand, some days during this time saw a negative bias of -6% or lower.
This negative demand bias likely drove the negative DARTs observed across ERCOT hubs for many hours, with the most pronounced negative DARTs occurring during the evening peak hours.
PJM
December 23
Demand
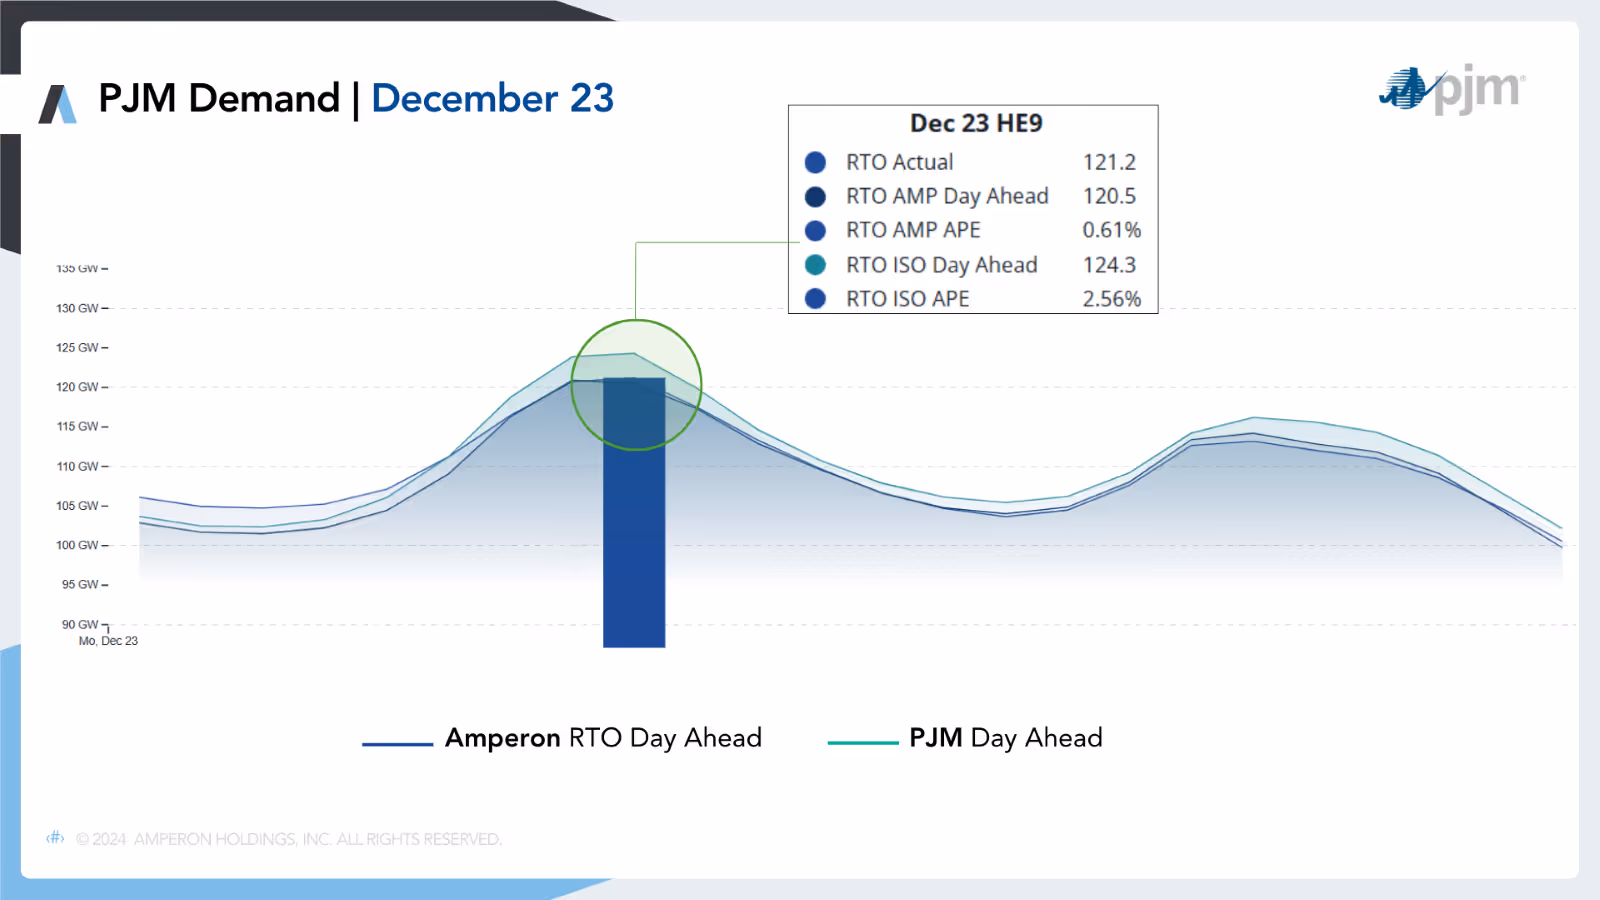
This day marked the highest winter demand peak for PJM in December 2024, reaching 121.2 GW at HE9. PJM overestimated demand by roughly 3 GW at this hour, likely contributing to significantly positive DARTs across PJM-RTO. Amperon's forecast outperformed PJM's, with a MAPE on the 23rd that was 51.18% more accurate.
Although Amperon's forecast was about 700 MW lower, it provided crucial insight for clients, highlighting that peak demand on the coldest morning would fall short of the extreme levels predicted by PJM.
PJM
December 23
Net Demand
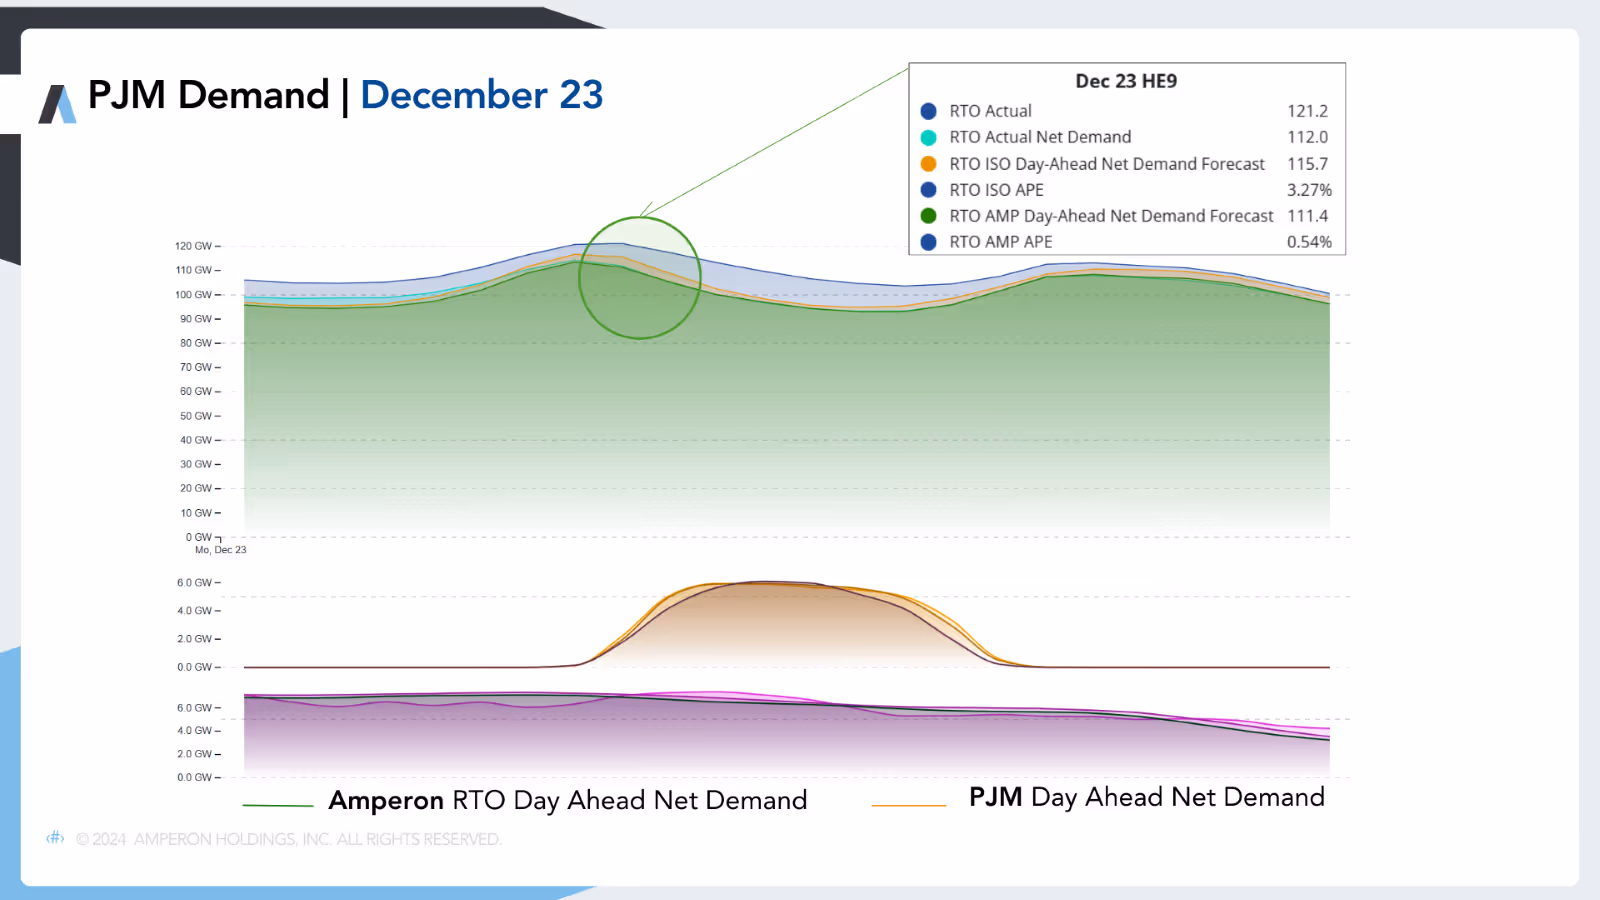
At the peak demand hour, Amperon's net demand forecast outperformed PJM’s, with our APE being 83.33% more accurate. Positive DART spreads were driven by renewables performing as expected and demand settling much lower than PJM's forecast.
Real-time prices during HE9 ranged from $23 to $61, compared to day-ahead prices, which cleared at $69.
NYISO
December 21-23
Demand
During this period, temperatures dropped into the teens, with morning lows reaching single digits. Temperatures settled colder than forecasted and these extreme conditions drove higher-than expected energy demand and elevated prices.
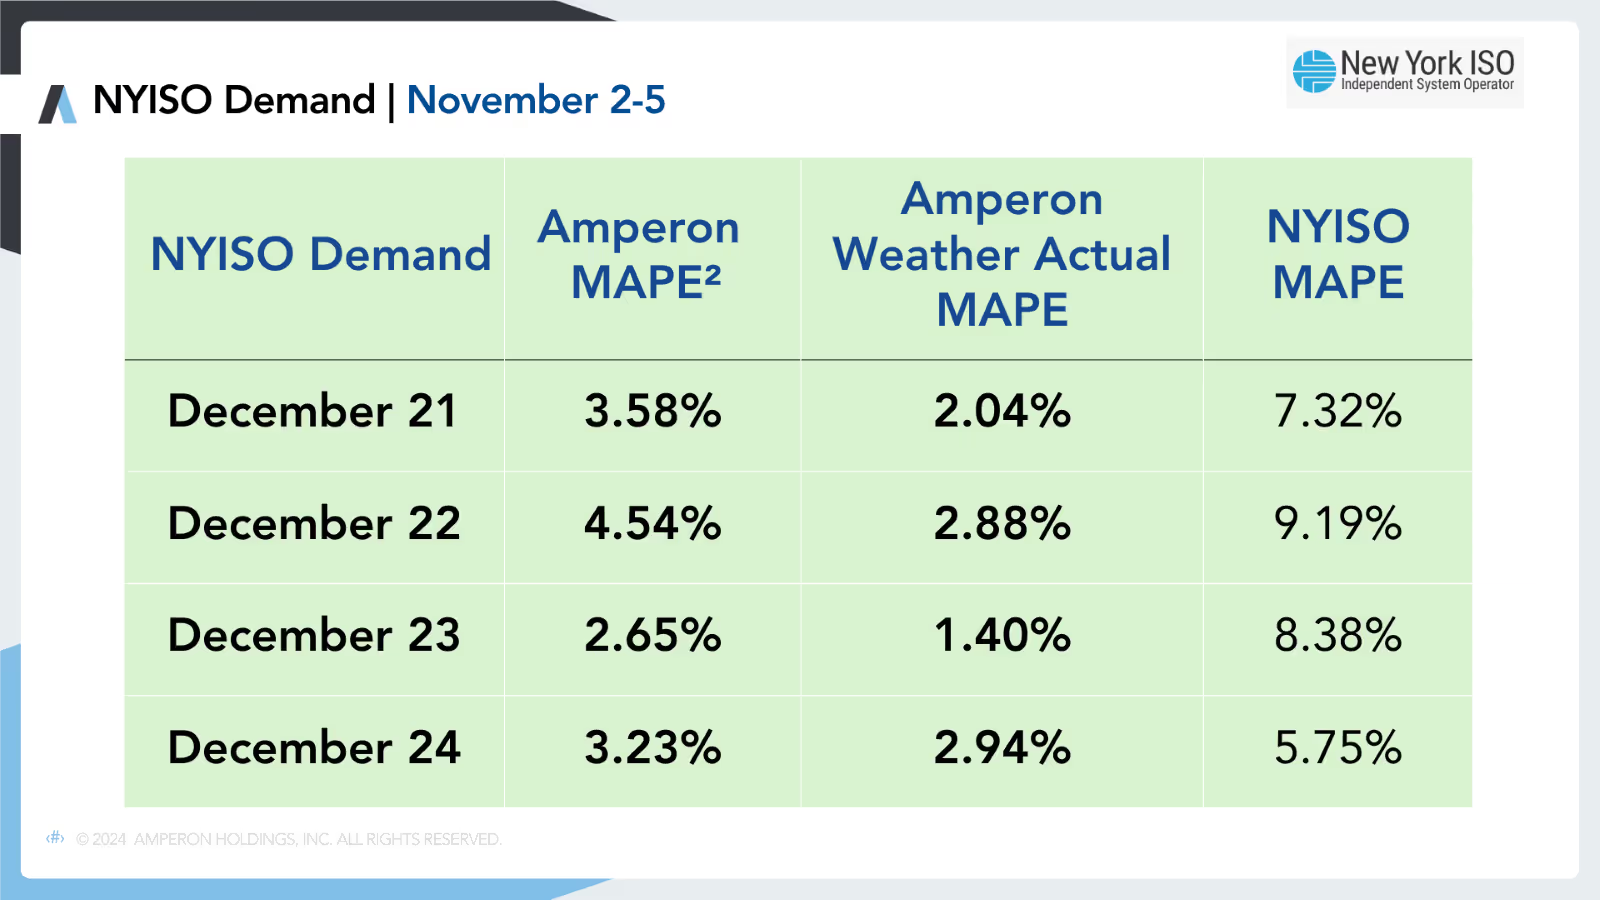
From December 21-24, real-time prices consistently exceeded day-ahead prices, resulting in negative DARTs during several hours. Amperon consistently outperformed NYISO’s demand forecast, with NYISO under forecasting demand across this period.
Amperon's weather actual predictions, based on the actual weather and not forecasted weather, resulted in even better MAPEs. At peak hours, Amperon's forecast outperformed NYISO's, which is typically the most volatile time of the day

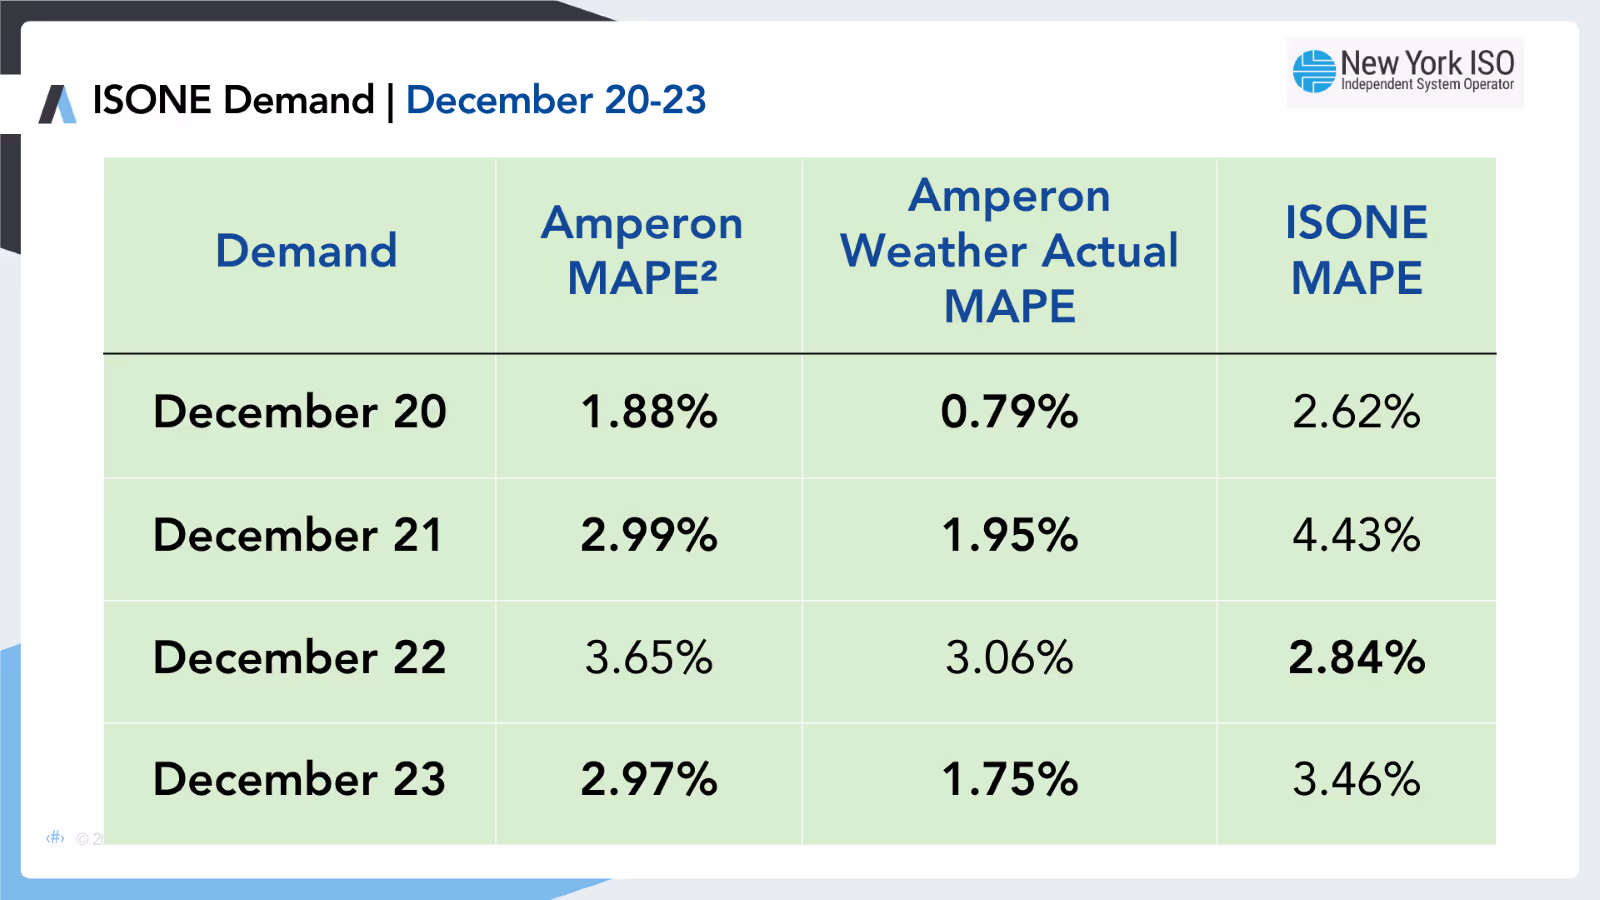
ISONE
December 20-23
Demand
During this period, temperatures dropped into the teens, with morning lows reaching single digits. These extreme conditions, which were colder than forecasted, drove higher-than-normal energy demand and elevated prices.
From December 20-24, real-time prices consistently exceeded day-ahead prices, especially around the morning and evening peak hours, resulting in negative DARTs.
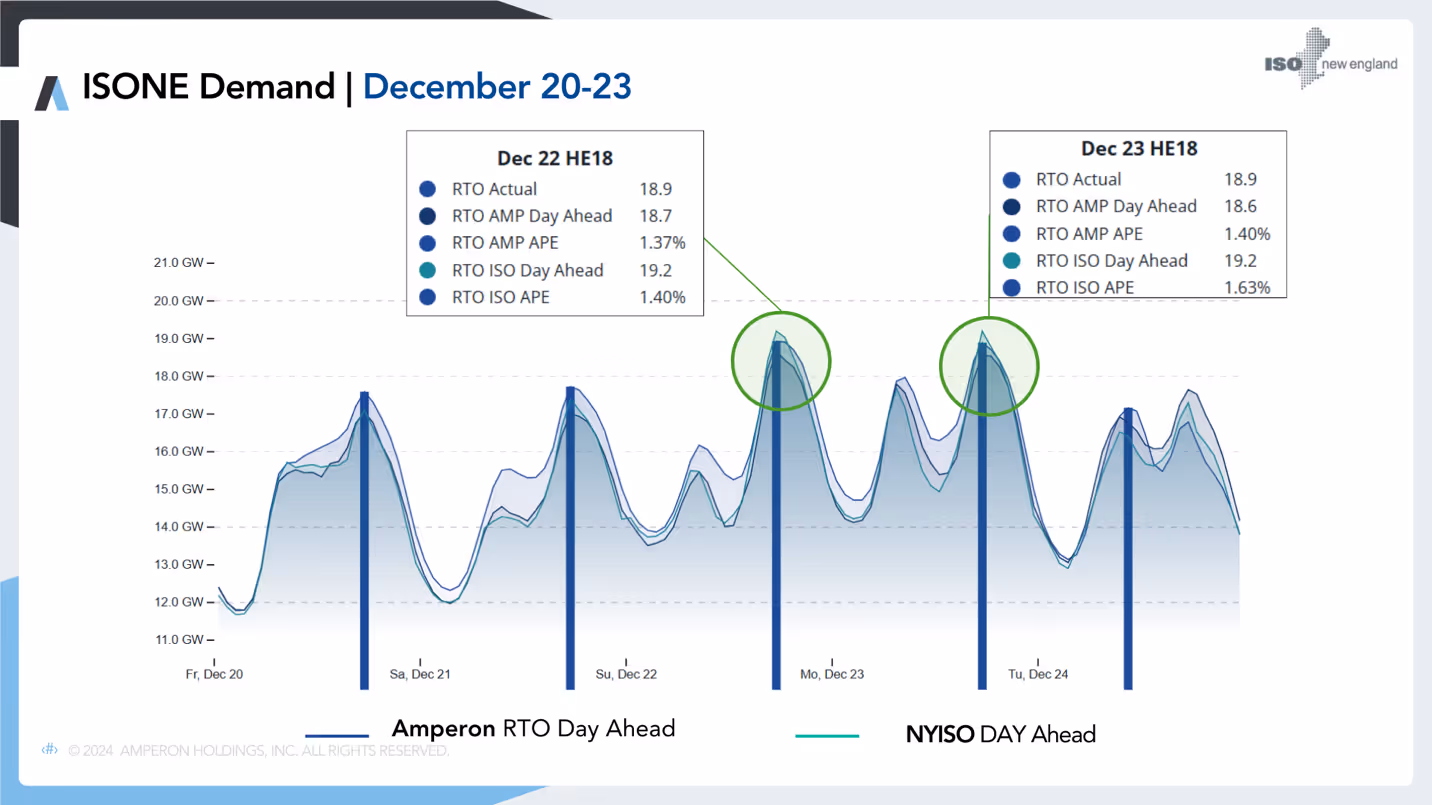
Amperon's weather actual predictions resulted in even better MAPEs once the actual weather was re-run through our models.
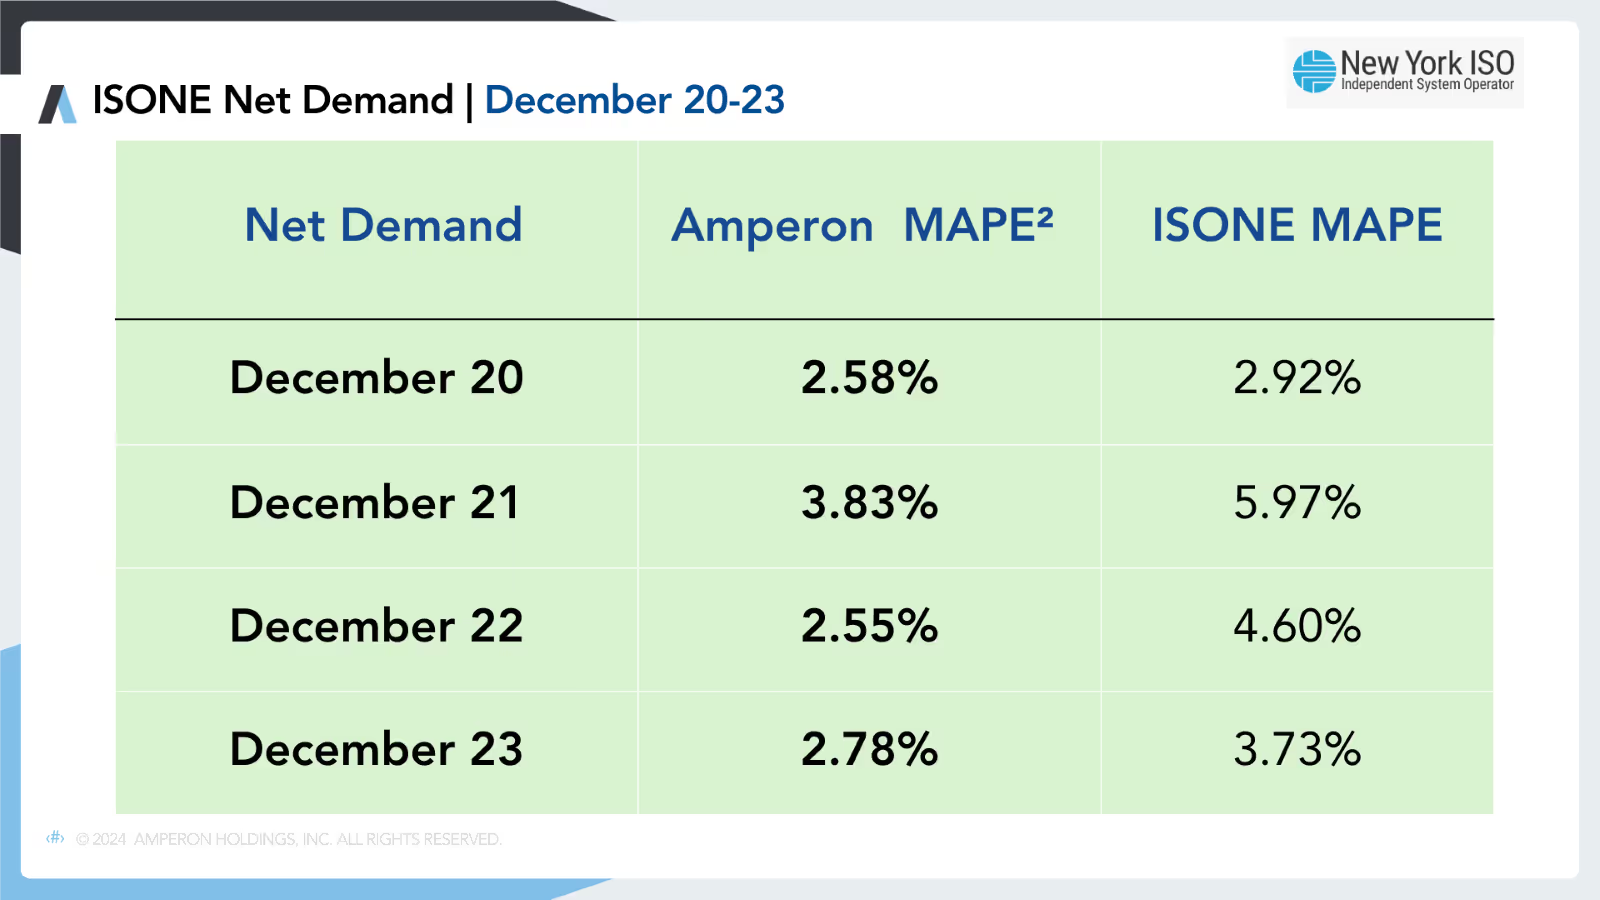
Net demand settled higher than expected due to underperformance of renewables across this period. Amperon’s forecast outperformed ISONE’s, particularly during the peak net demand hour of the day. These factors also contributed to higher real-time prices during volatile periods, driving negative DARTs during high-demand hours.
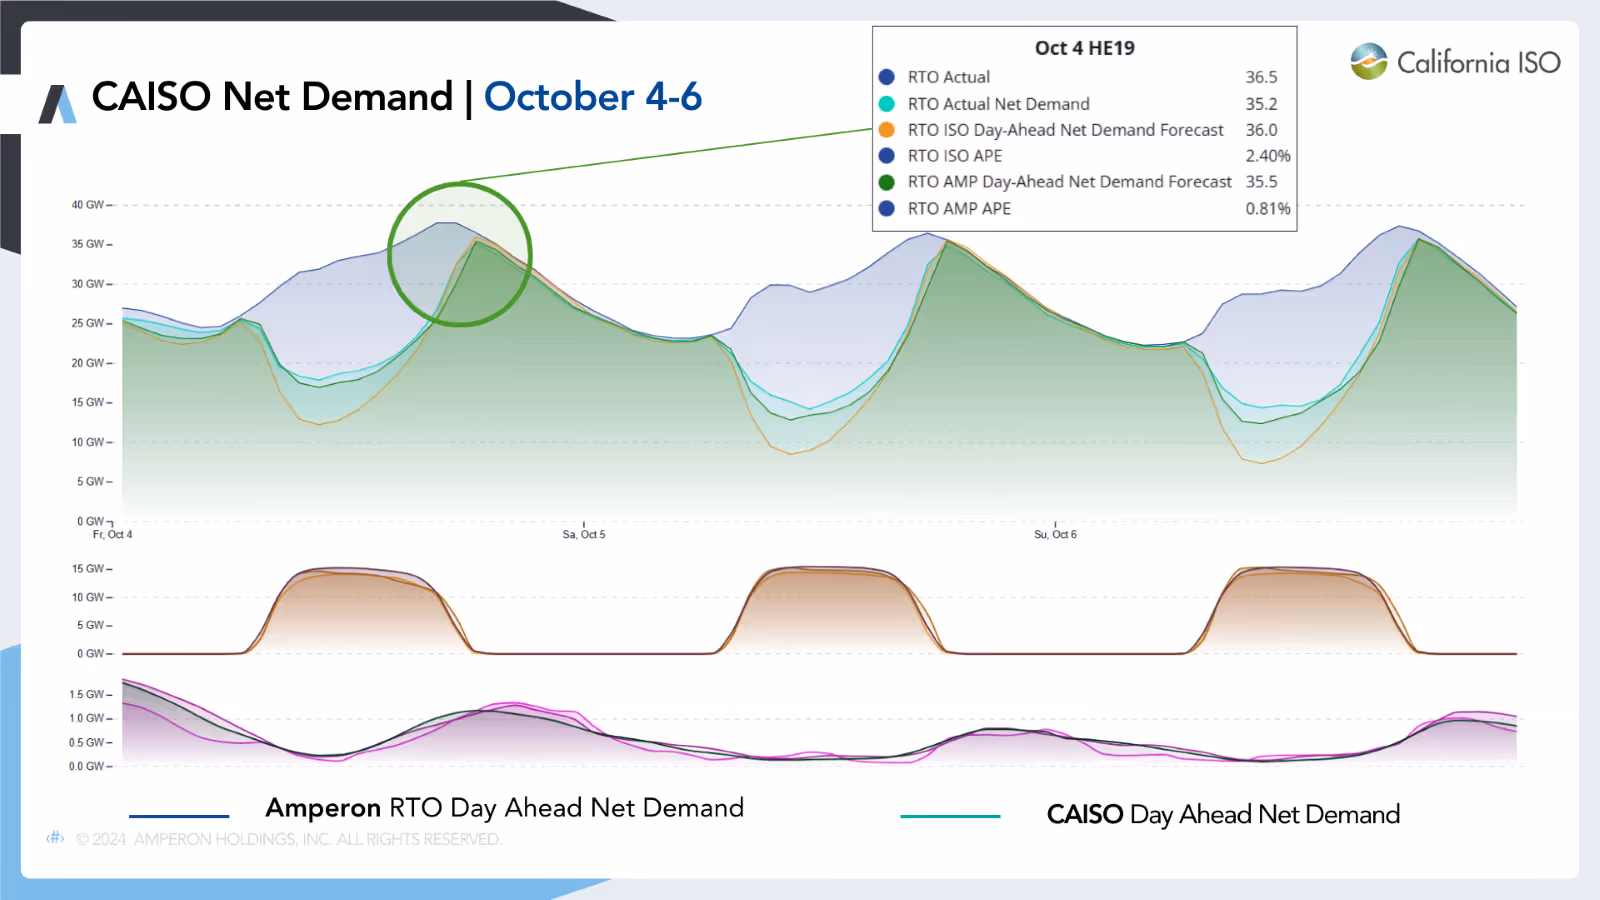
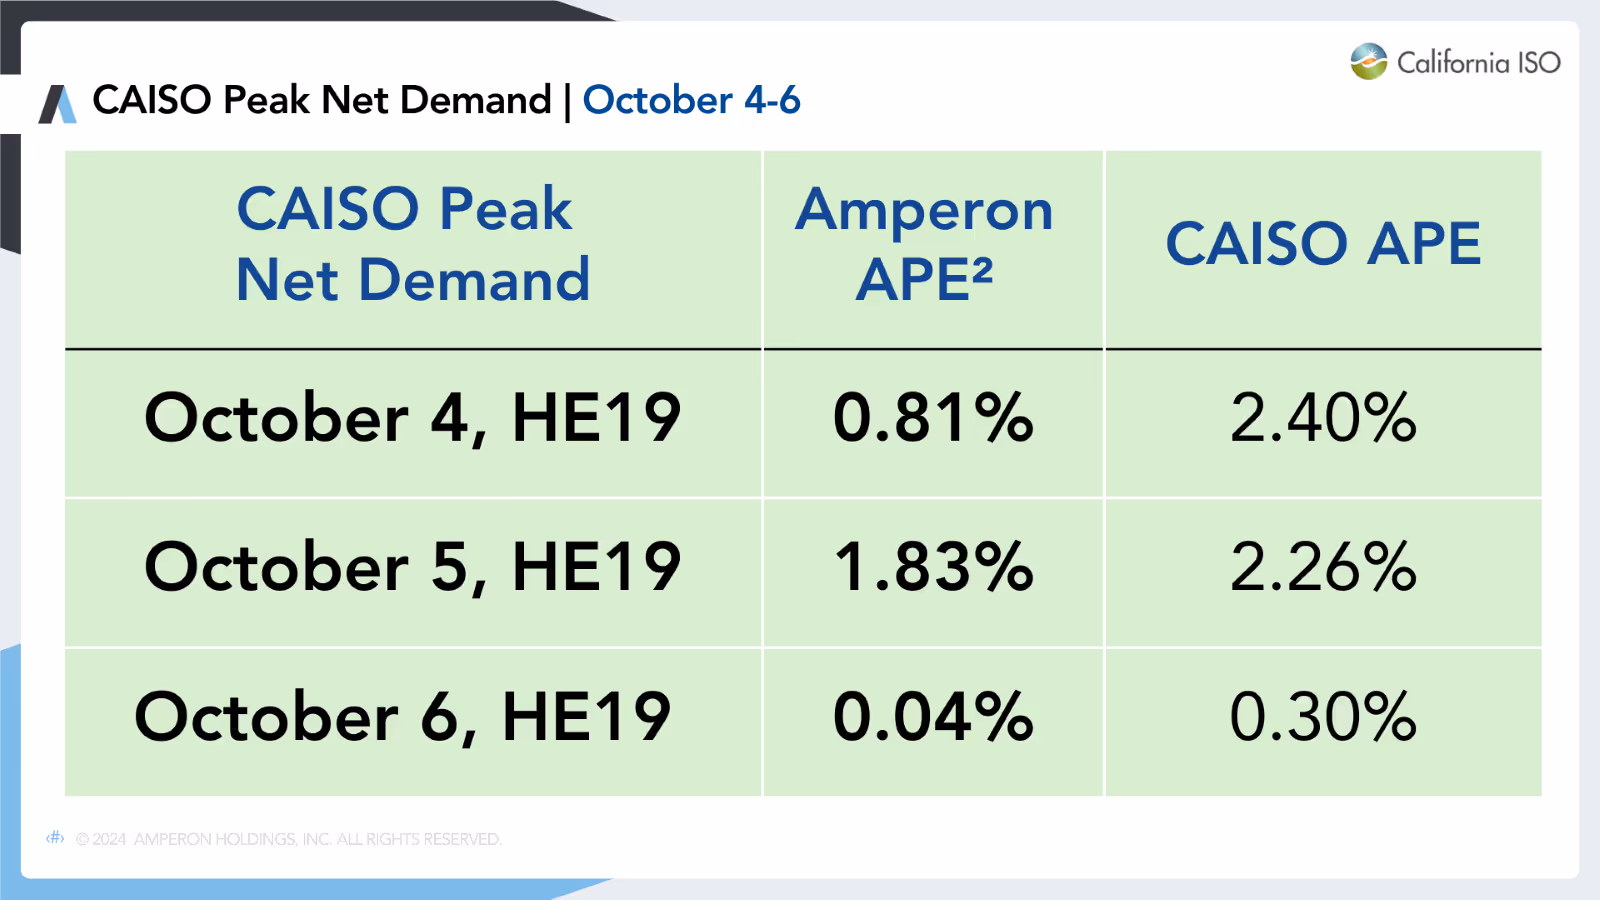
CAISO
December 20-23
Net Demand
During this period, CAISO day-ahead prices cleared just under $200 at the evening peak price hour. On October 4 and 5, CAISO overestimated net demand in its forecasts compared to actuals, likely contributing to the very positive DARTs observed during the evening peaks on these dates.
Amperon's net demand forecast outperformed CAISO's consistently over these evenings, offering critical insights that net demand could settle lower than CAISO's overestimate. This foresight likely played a key role in identifying the drivers of positive DARTs.
Amperon's net demand forecast outperformed CAISO's consistently over these evenings, offering critical insights that net demand could settle lower than CAISO's overestimate. This foresight likely played a key role in identifying the drivers of positive DARTs.
.

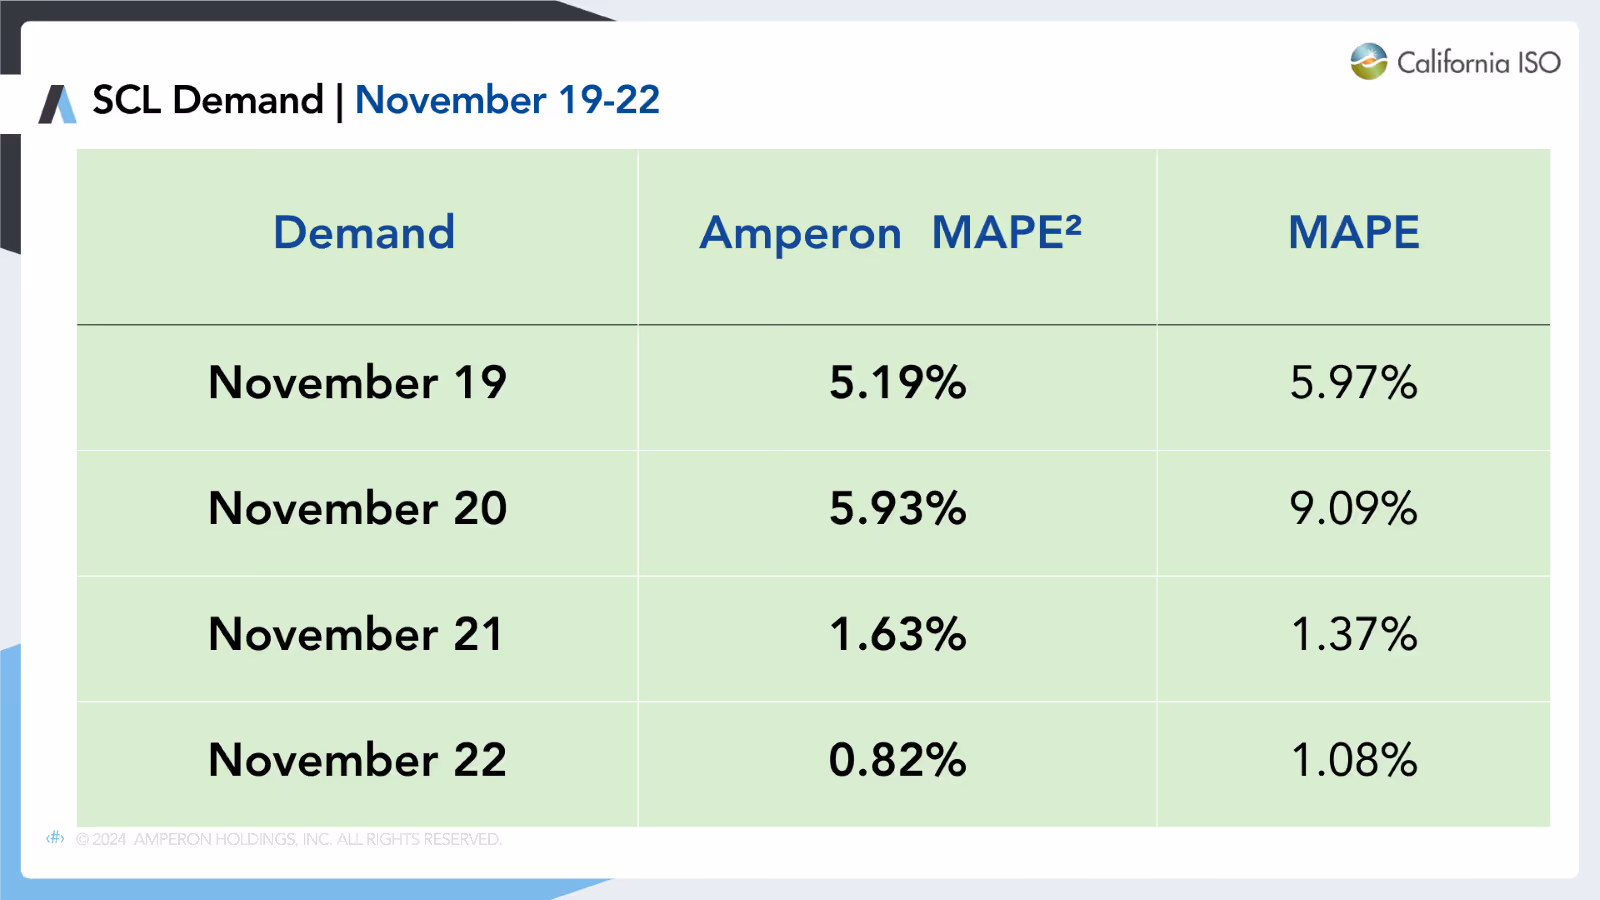
WEIM: Seattle City Light (SCL)
November 19-22 (Bombogenesis Storm)
Demand
During this period, a powerful low-pressure system swept through the Pacific Northwest, bringing intense winds and heavy rain and snowfall. Lower elevations saw 12-16 inches of rain in some areas, while higher elevations received snow.
Wind gusts reached up to 77 mph in some regions, causing widespread power outages that left hundreds of thousands without electricity. Throughout this extreme weather event, Amperon's demand forecast consistently outperformed the ISO's, even during peak demand hours each day.

.
MISO
December 11-13
Demand
During this time, average temperatures dropped as low as 11 degrees with even colder temperatures across MISO. The highest demand peak of 93.2 GW occurred December 12 at HE9. Amperon's forecast was 63.84% better at this hour.

When eliminating the weather error, this improved our forecast making Amperon's APE 84.7% better than MISO's at this peak demand hour Amperon's average MAPE across these days settled 52.77% better than MISO's MAPE.
Across the Price-Informed Peak hours (HE7, HE17-HE20), Amperon's MAPE was 45.33% better than MISO's.

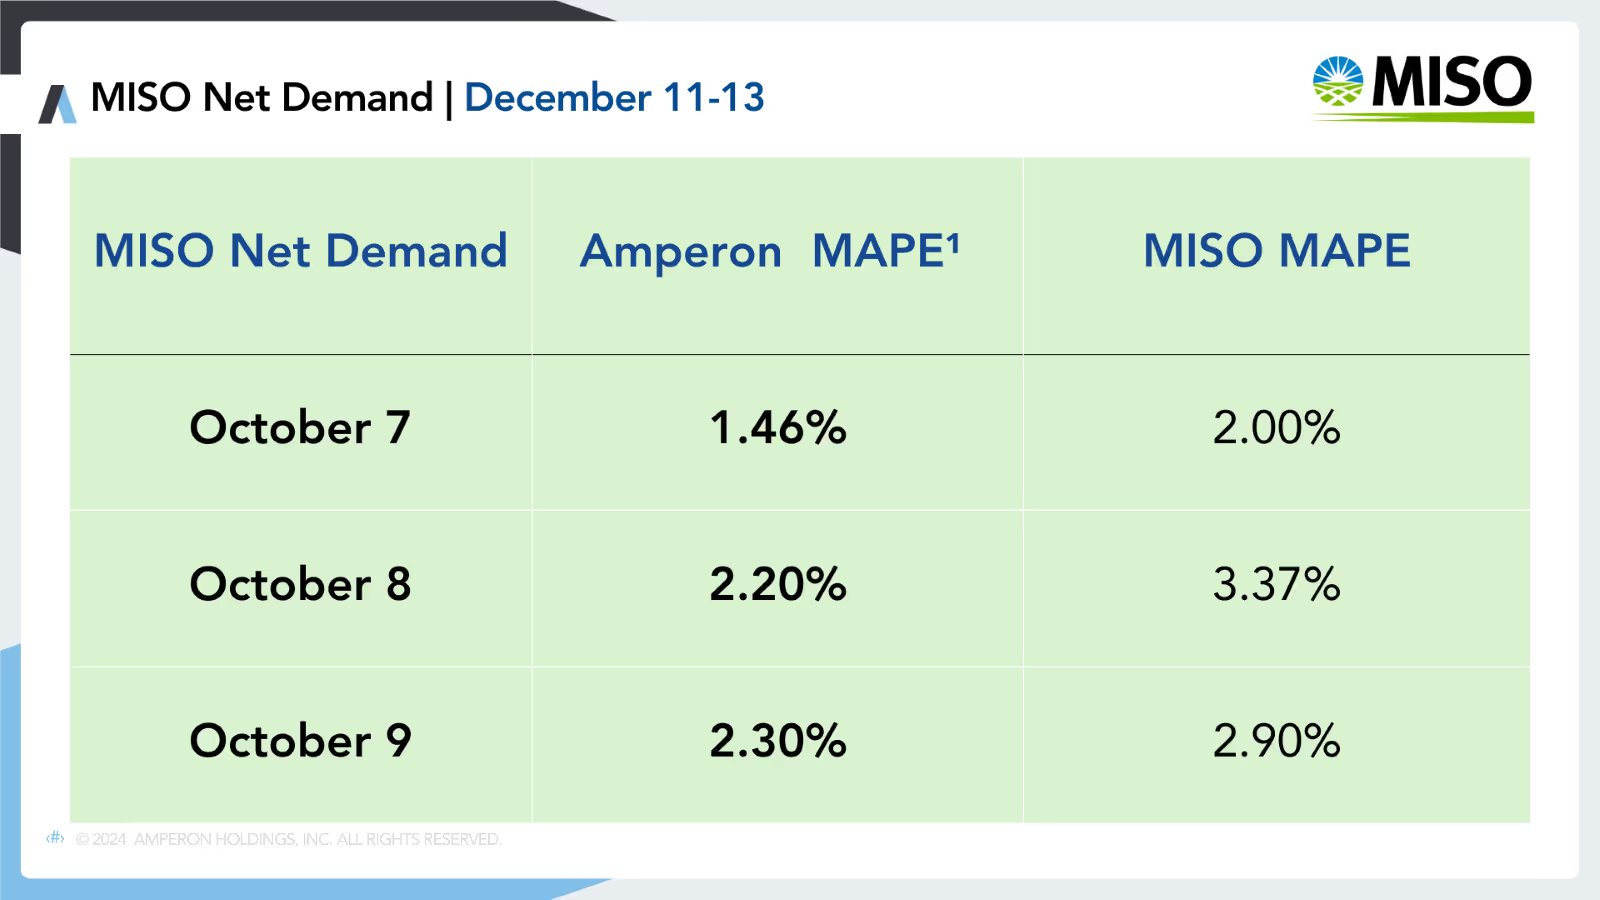
MISO
October 7-9
Net Demand
During this period, wind generation was lower than normal, leading to higher-than-usual net demand for the ISO. Weak wind conditions aligned with the evening demand peak on most days, most likely contributing to price volatility in some zones.
Amperon's Net Demand forecast consistently outperformed MISO’s, particularly during the peak net demand hour each day. On October 7th, real-time prices spiked above $1,000 in a few isolated intervals.
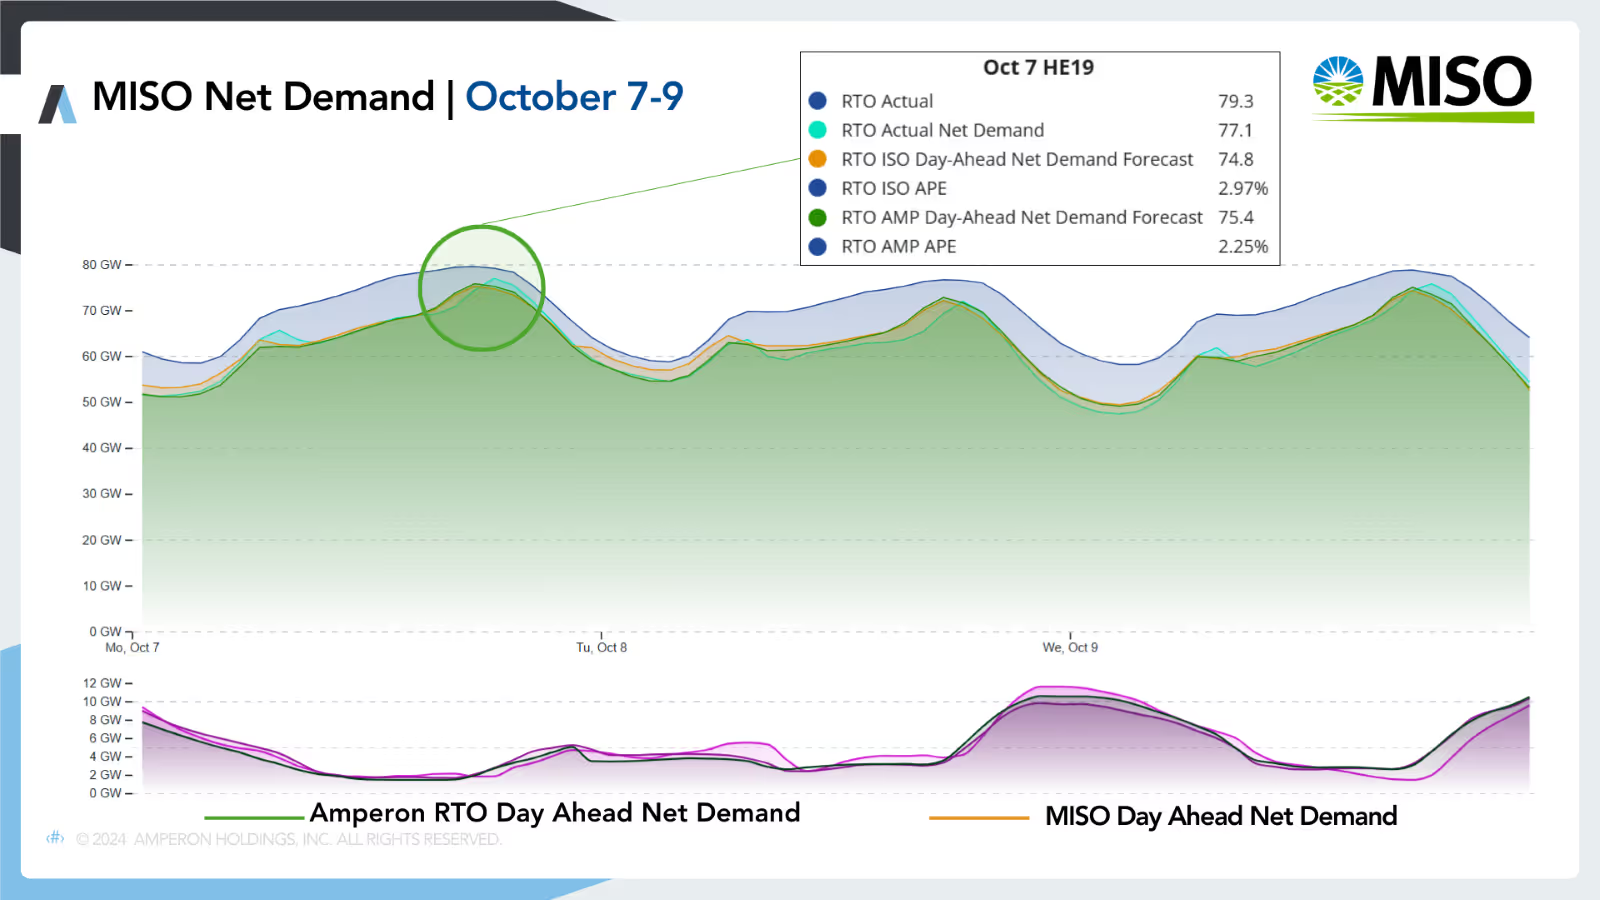
Using Amperon's Net Demand forecast could have provided early insight that real-time net demand might settle higher, signaling potential price volatility.
At the hour with the highest real-time price spike (HE21), Amperon’s forecast was approximately 3.72% more accurate than MISO's.
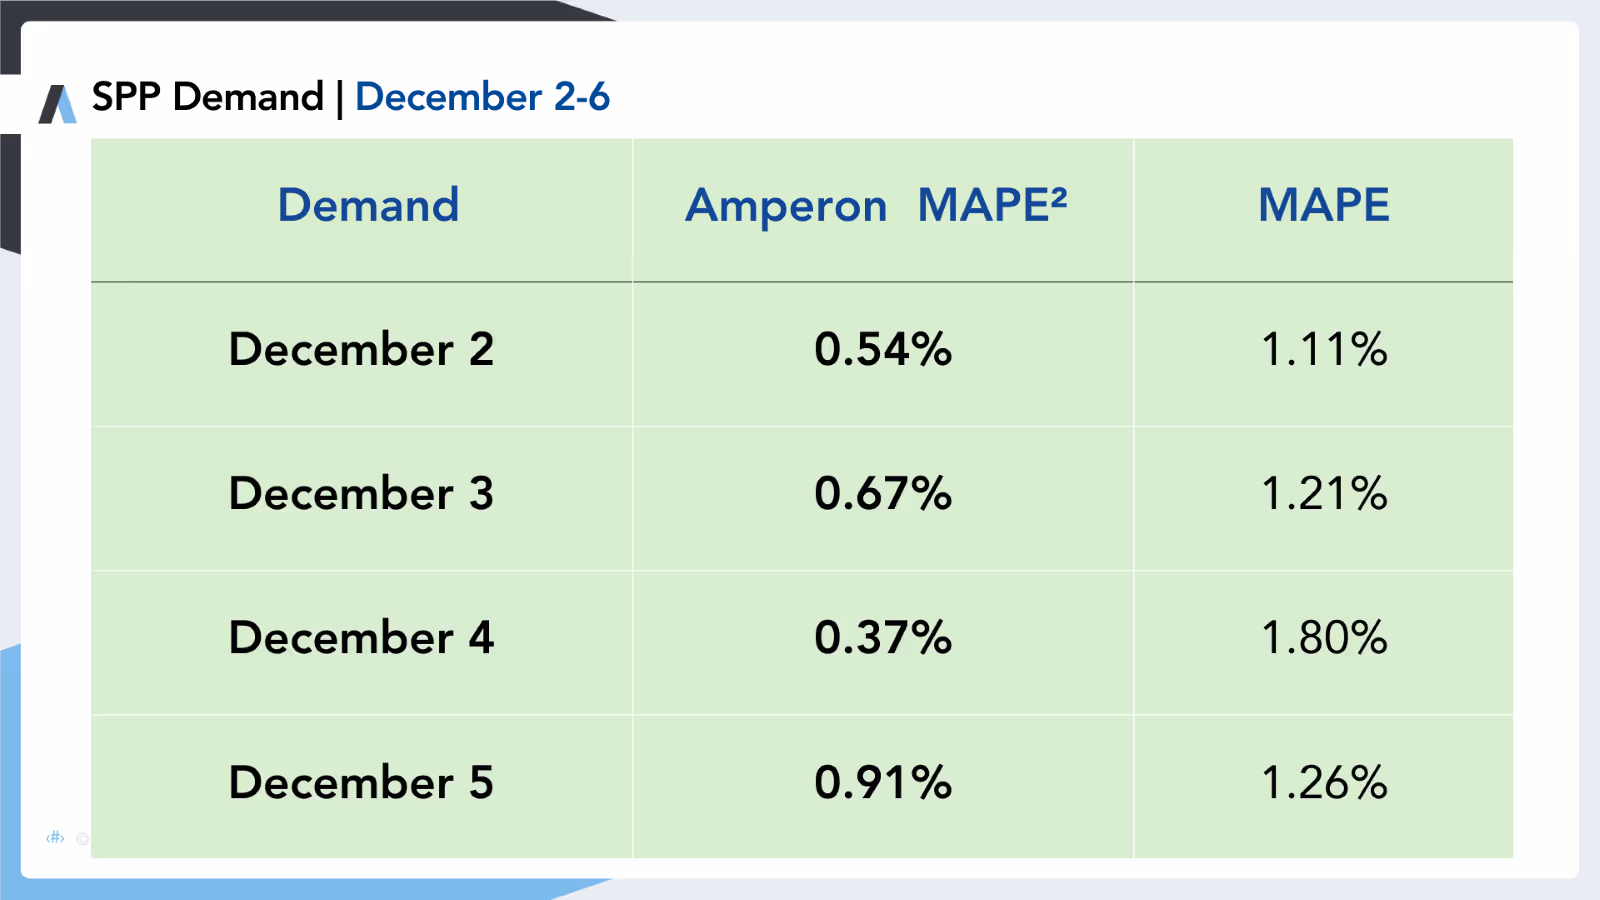
SPP
December 2-6
Demand
During this period, temperatures dropped as low as 22°F, with demand peaking just shy of 39 GW on December 6 at HE8. A brief period of warmer weather from December 3 into early December 4 led to temporarily lower demand.
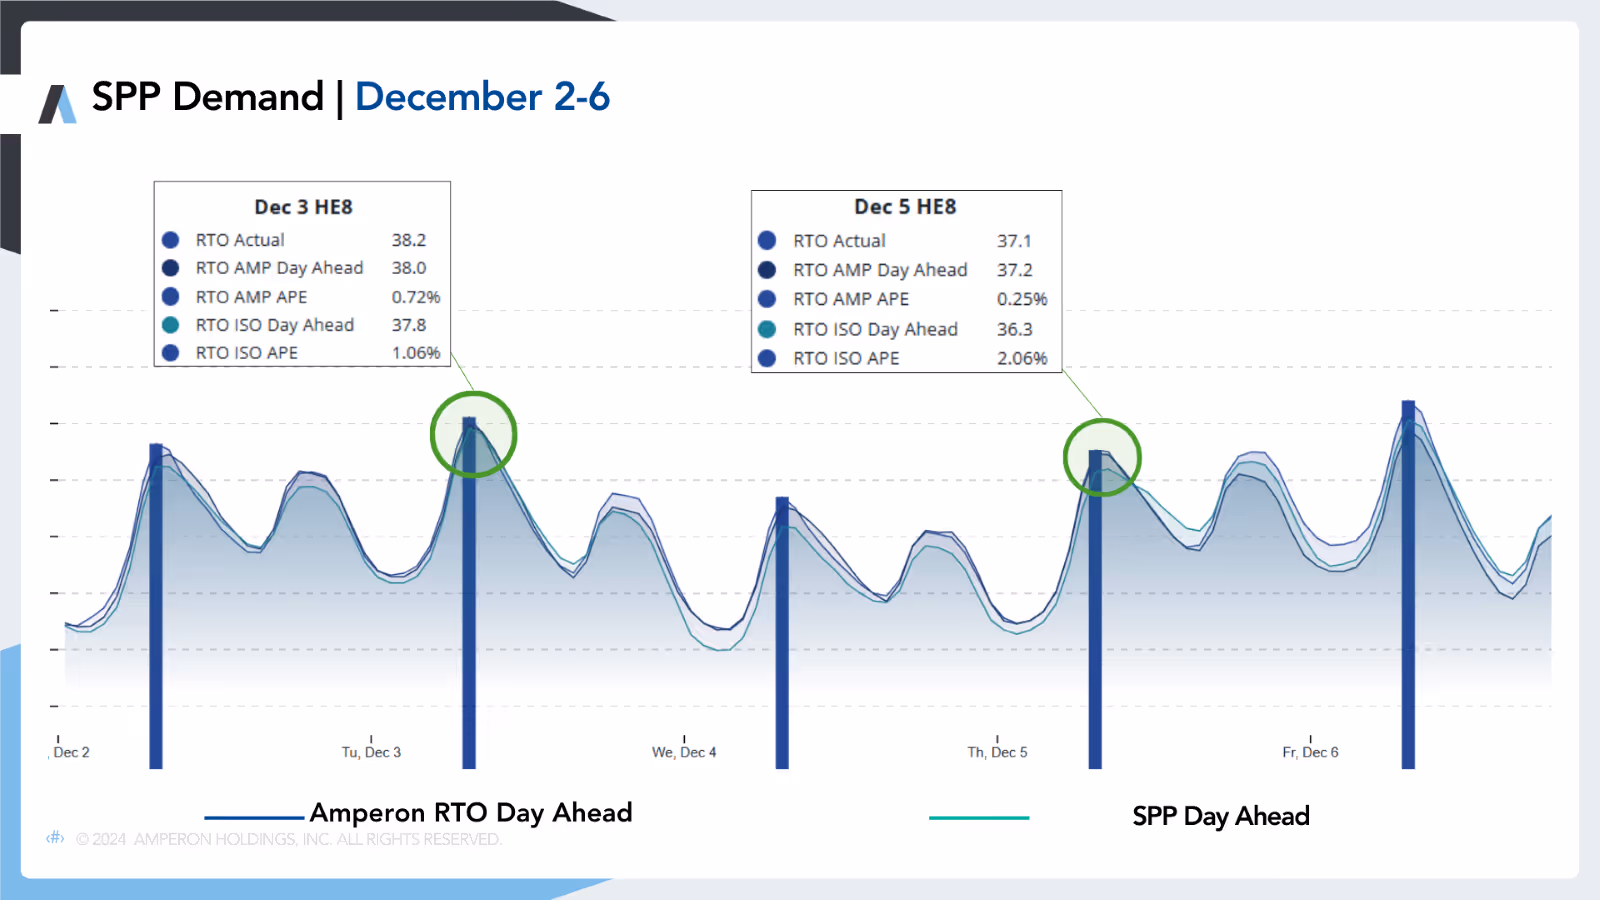
Amperon's MAPEs consistently outperformed SPP at peak hours and throughout this period.
Amperon's net demand forecast outperformed SPP’s by 32.33% over these days. Amperon's wind NMAE averaged 8.79%, coming in 34% better than SPP’s day-ahead wind forecast.
December 2nd saw the most price spikes in North and South hub, most likely due to demand settling higher than the ISO's forecast and elevated net demand levels.
What's in store for the rest of winter? Watch our Mid-Winter Update with Dr. Mark Shipham, Amperon's Chief Meteorologist to gain valuable insights on volatile weather.


.svg)


%20(3).png)
%20(2).png)
%20(1).png)


.png)


.avif)


.avif)

.avif)


.avif)


.avif)
%20(15).avif)

.avif)
%20(10).avif)

.avif)


.avif)

.avif)


.avif)


