Behind every light switch and furnace is a set of markets that most people never see. Energy trading is the buying and selling of electricity, natural gas, and other energy products, either to protect against price changes or to profit from them. It goes on in the background every hour of every day, often months or years before anyone uses the energy.
Utilities use energy trading to lock in what they will pay, and power producers use it to secure their revenue. Financial traders take positions on where prices are headed, which helps both buyers and sellers by adding liquidity to the market and taking on risk.
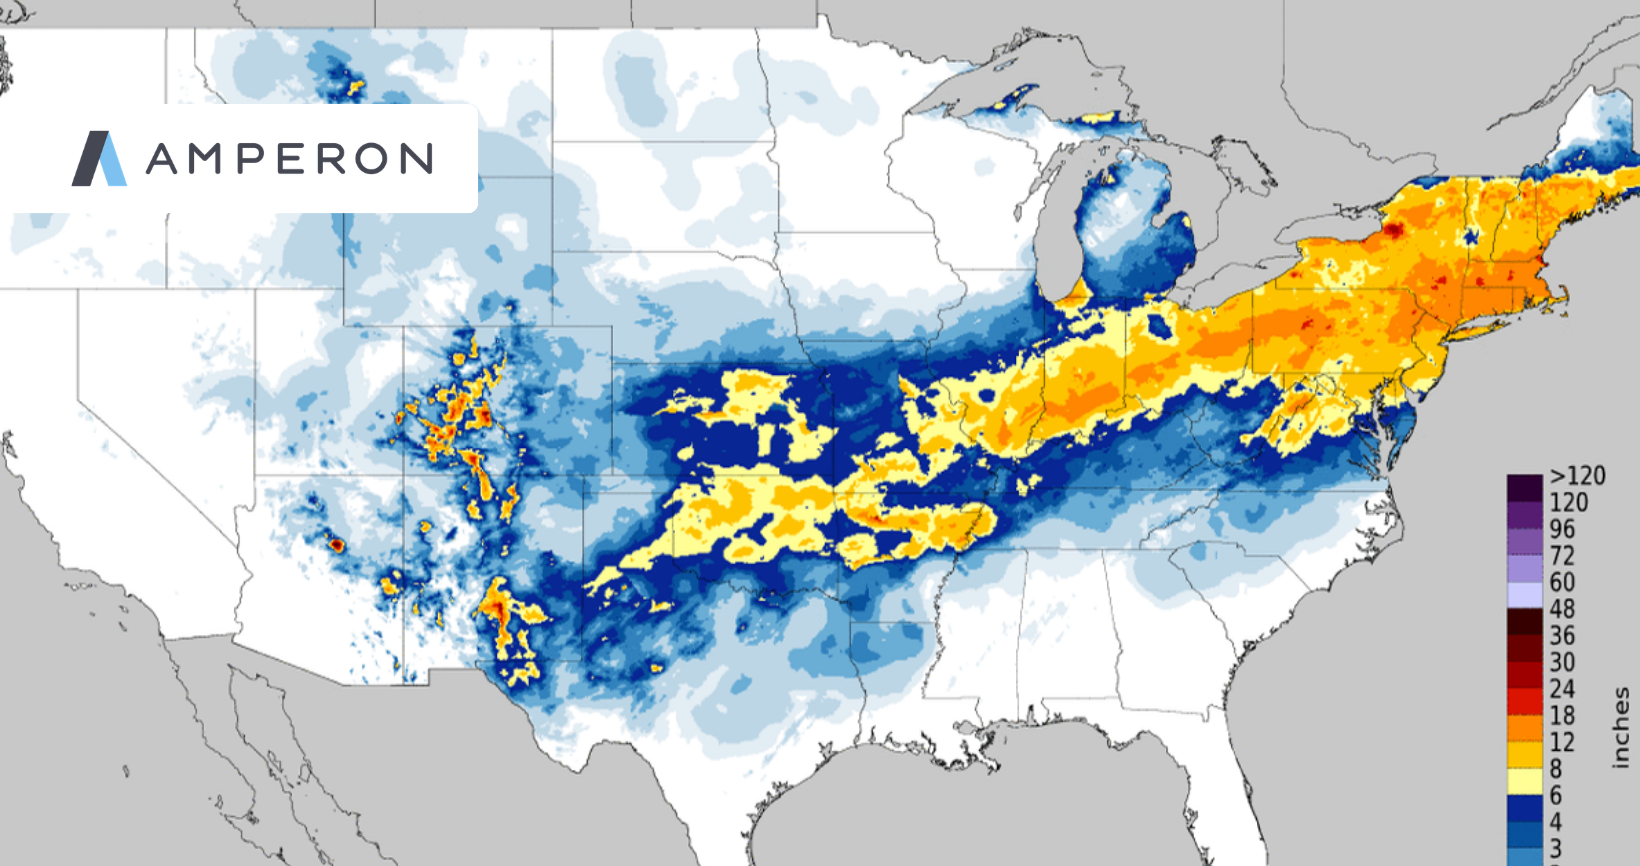
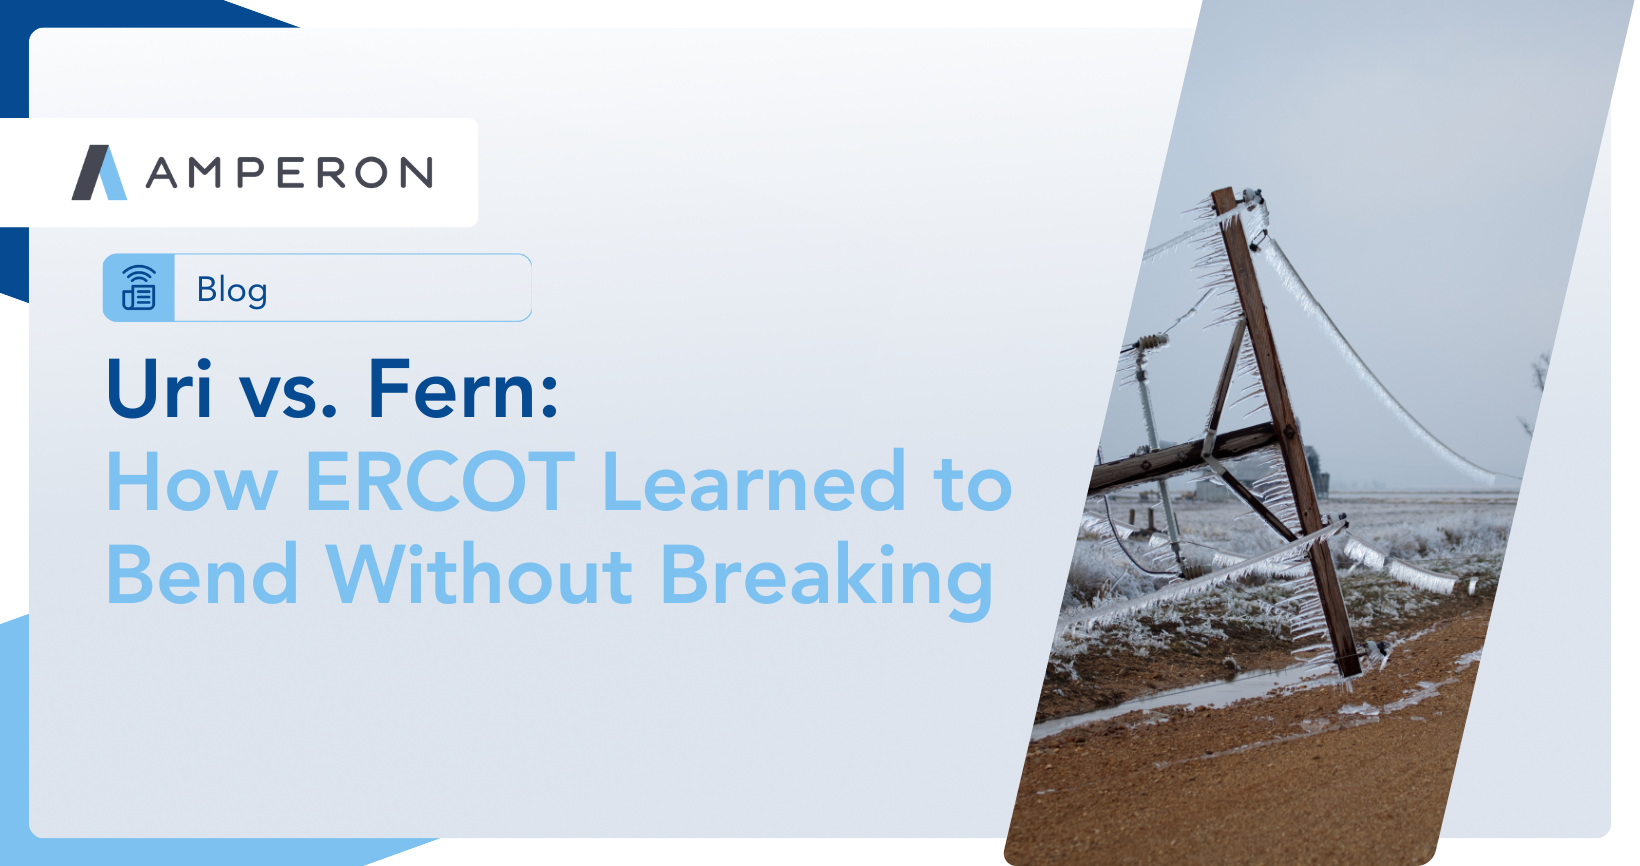
Most of the time, that work goes unnoticed. Then the weather turns. When Winter Storm Fern brought extreme cold to much of the US in January 2026, the benchmark US gas price nearly doubled and peak-hour power prices in the eastern US jumped to several times their usual level. A company that had already locked in its prices was shielded from much of that swing.
Someone has to take the other side of those deals. Energy traders make those arrangements possible by taking on that risk in exchange for the chance of a profit. This guide covers energy trading basics in plain language, including what gets traded, who trades it, how the markets work, and how traders manage risk.
Utilities use energy trading to lock in what they will pay, and power producers use it to secure their revenue. Financial traders take positions on where prices are headed, which helps both buyers and sellers.
What is energy trading?
Energy trading is the buying and selling of energy, such as electricity, natural gas, and oil, along with related products like renewable energy certificates and carbon allowances. Companies trade energy either to protect themselves from price changes or to profit from them.
Protecting against price changes is called hedging. A utility that agrees today on a fixed price for natural gas it will burn next winter is hedging, because if prices spike, it's covered.
Trading to profit from price changes is called speculating. A trader who expects a cold winter might buy that same gas, hoping to sell it later for more. Hedgers and speculators usually meet in the same markets, and each needs the other.
Hedgers and speculators usually meet in the same markets, and each needs the other.
Trades can also be physical or financial. A physical trade ends with energy delivered, such as gas flowing through a pipeline to a power plant. A financial trade settles in cash based on a price, and no energy changes hands. Many companies use both.
A physical trade ends with energy delivered, such as gas flowing through a pipeline to a power plant. A financial trade settles in cash based on a price, and no energy changes hands.
If you're mainly interested in electricity, our guide to power trading goes deeper into how power markets and trading desks work.
Why does energy trading matter?
Energy trading makes costs more predictable for the people and businesses that depend on energy, and it helps pay for new supply.
Without a way to lock in prices, a utility would have to pass every swing in gas or power prices straight through to its customers. Trading lets it spread that risk out ahead of time.
Without a way to lock in prices, a utility would have to pass every swing in gas or power prices straight through to its customers.
Producers benefit too. A developer building a solar farm can sign a long-term contract to sell its output at a set price, which makes it easier to borrow the money to build. And because so many buyers and sellers trade every day, market prices give everyone a shared, up-to-date signal of what energy is worth today and in the years ahead, which guides decisions about where to build and when to buy.
What gets traded?
The main products in energy commodity trading are electricity, natural gas, oil, power plant capacity, transmission rights, and environmental attributes. Energy trading is a collection of linked markets, each with its own buyers, sellers, and risks.
Electricity
Companies trade electricity in wholesale markets, most of them run by grid operators, where prices form a day ahead and then adjust in real time as conditions change. Companies also trade contracts for power delivered weeks, months, or years in the future. Because electricity is hard to store in large amounts, its price can swing dramatically from one hour to the next. Utilities want stable costs, and power plant owners want reliable revenue. Our power trading guide explains these markets in detail.
Natural gas
Natural gas heats homes, fuels factories and industrial processes, and, in the US and many other countries, generates more electricity than any other source: about 40% in 2025. It moves through pipelines and is traded at hubs, which are points where several pipelines meet and where prices are set. The best known is Henry Hub in Louisiana, the benchmark for US gas prices. In Europe, the main benchmark is the Title Transfer Facility (TTF) in the Netherlands. Anyone who buys or sells electricity also watches gas prices closely.
Oil and refined products
Oil and refined products like gasoline, diesel, and jet fuel trade in large global markets, priced against benchmarks such as Brent and West Texas Intermediate. They play only a small role in most electricity systems, so this guide mentions them for context only.
Capacity
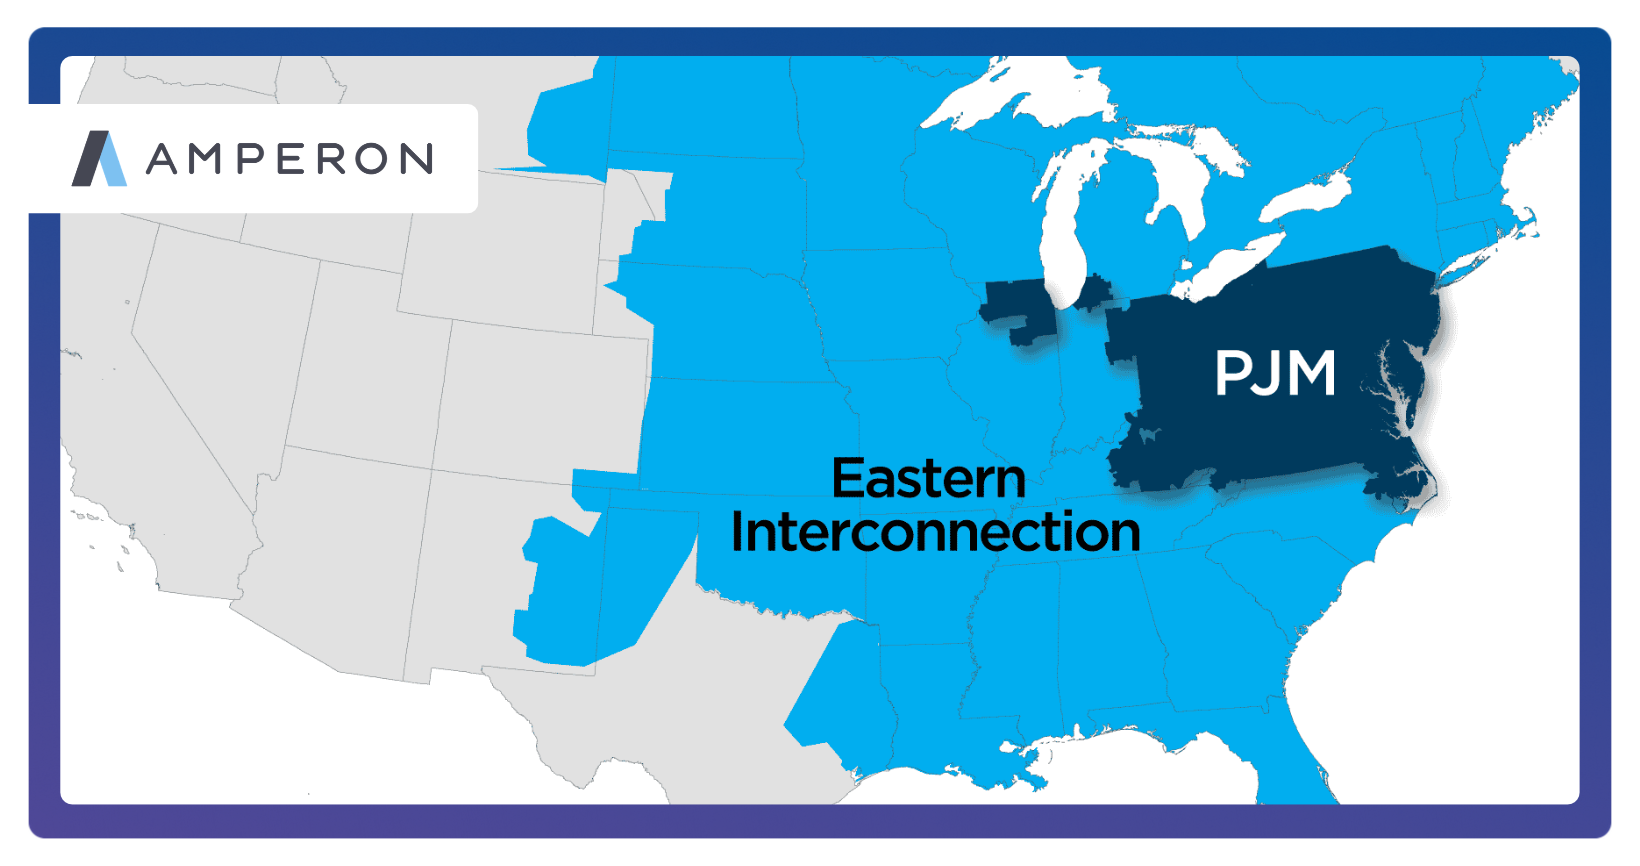
Capacity is a commitment to have power available when the grid needs it, whether from a power plant or from customers who agree to use less during peak hours. In some regions, grid operators hold auctions that pay for capacity years in advance. PJM, which runs the grid across the Mid-Atlantic and parts of the Midwest, holds one of the largest, as our PJM Market Guide explains. Plant owners earn revenue for being ready, and utilities pay to make sure there is enough supply on the hottest and coldest days.
Transmission rights
Financial transmission rights (FTRs) and similar congestion hedges are contracts that pay out based on price differences caused by crowded power lines, and our FTR strategies guide covers how they're traded.
Environmental commodities
Environmental commodities are tradable certificates and permits tied to clean energy and emissions. The two most common are renewable energy certificates and carbon allowances. A renewable energy certificate, or REC, is proof that one megawatt-hour of electricity came from a renewable source such as wind or solar. RECs can be sold separately from the electricity itself, so REC trading has its own buyers, sellers, and prices. Carbon allowances are permits to emit greenhouse gases under cap-and-trade programs such as the European Union's Emissions Trading System, where one allowance covers one tonne of carbon dioxide.
How are gas, power, and other commodities connected?
Natural gas prices often set electricity prices, and weather moves demand for both. The growth of wind and solar is also changing how they interact. Those links are what make energy trading different from trading any single product.
In many markets, gas-fired power plants are the last ones switched on to meet demand, and the last plant needed usually sets the price for all the others. As a result, wholesale electricity prices tend to rise and fall with natural gas prices.
Wholesale electricity prices tend to rise and fall with natural gas prices.
The link runs in the other direction too. In Italy, where gas-fired plants often set the price of power, a long heat wave drives up demand for air conditioning, which means burning more gas to generate electricity. As our 2026 European summer grid outlook explained, that extra gas burn competes with efforts to refill gas storage before winter, so a hot summer can leave gas supplies tighter heading into the cold months.
Weather affects both at once. A cold snap raises demand for gas to heat homes and for electricity to run heaters, and it can freeze gas wells and pipelines at the same moment. That's what happened during Winter Storm Fern, when record gas withdrawals and higher gas prices fed straight into power prices. Our post on how weather affects energy demand and prices covers this in more depth.
Wind and solar also affect gas demand. Together they supplied about 18% of US electricity in 2025, and EIA expects that share to keep growing. On sunny or windy days, they reduce how much gas power plants need to run, which can pull prices down. When the wind drops or the sun sets, gas plants are needed again. A trader who follows only one commodity can miss the shifts that move all of them.
A trader who follows only one commodity can miss the shifts that move all of them.
What do energy traders do?
What is an energy trader?
An energy trader is someone who buys and sells energy or energy contracts for their company. A typical day involves studying weather and demand forecasts, watching prices across several markets, deciding what to buy or sell, and staying within the risk limits the company has set. Traders who focus on electricity work against daily market deadlines; our Power Trading 101 guide walks through how a trading desk runs from morning to night.
Energy traders fall into three broad groups. Hedgers want to lock in costs, asset owners want to get the most from what they produce, and speculators take on risk in hopes of a profit.
Hedgers
Utilities, electricity and gas retailers, and large energy users like factories and data centers trade mainly to make their costs predictable. A utility that knows roughly what it will pay for power next summer can set customer rates with confidence, and a manufacturer can budget for energy the way it budgets for raw materials. For utilities and retailers, hedging is closely related to load risk management.
Asset owners
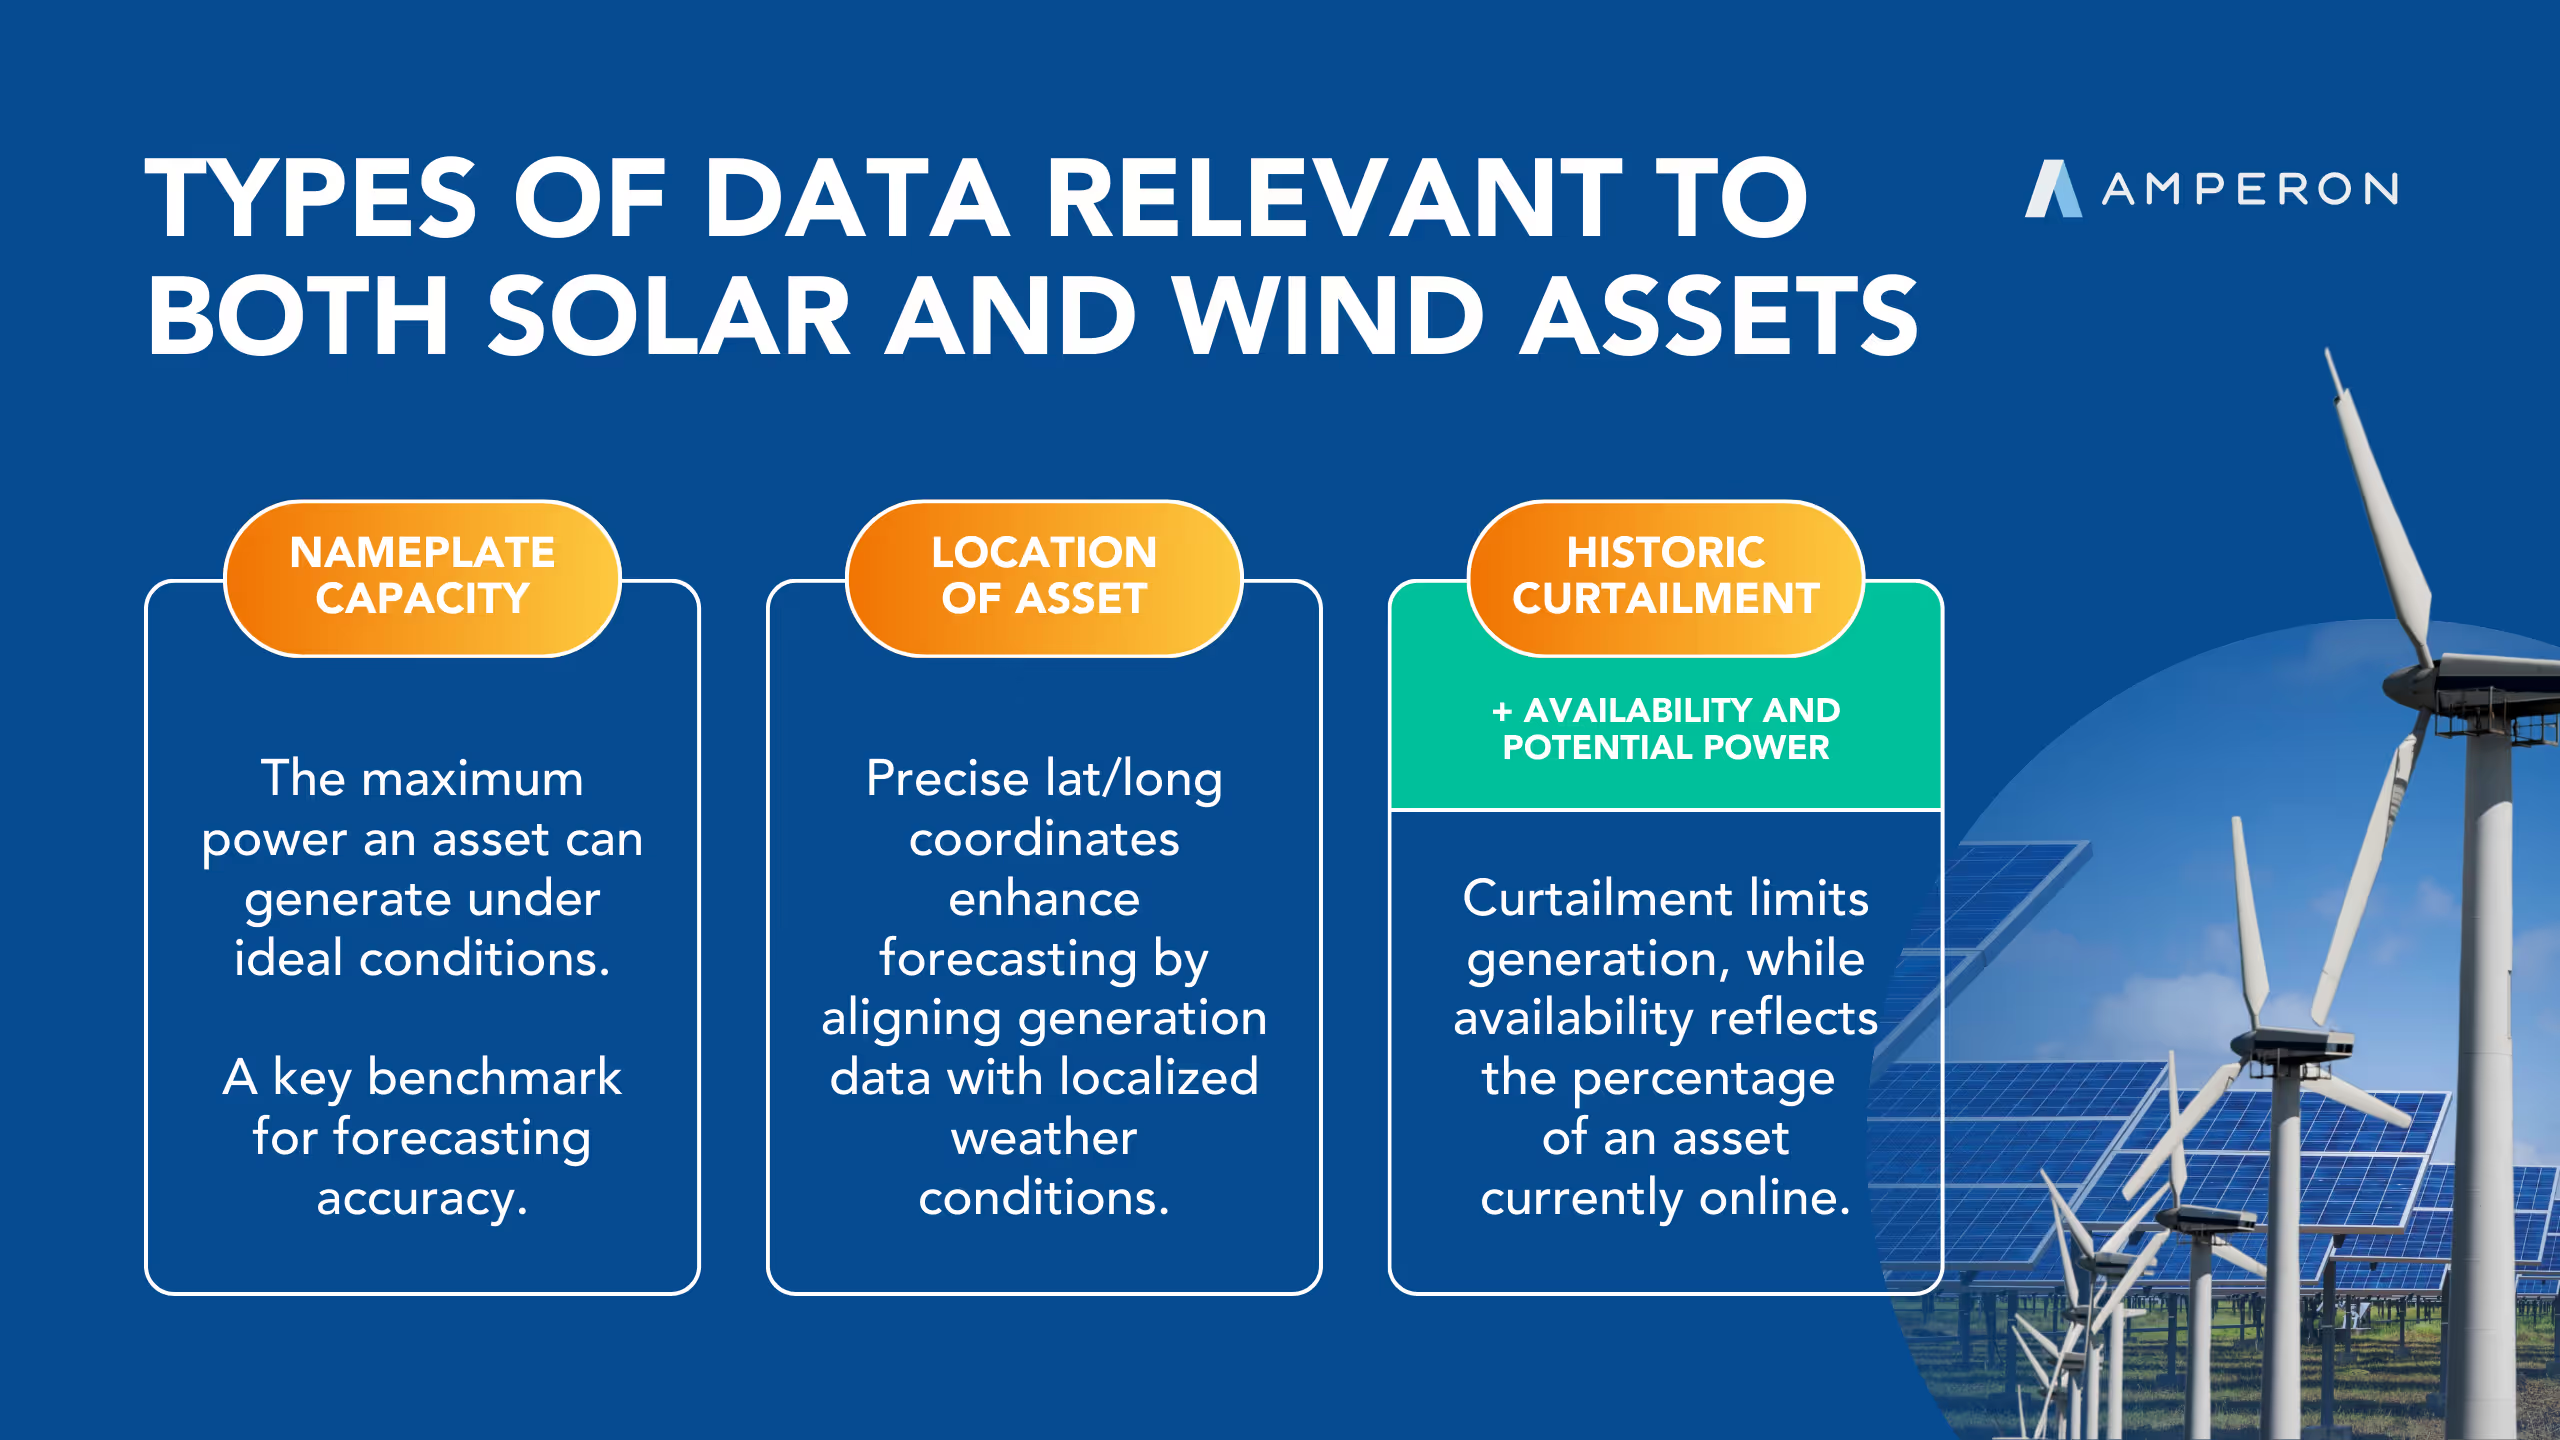
Power plant owners, gas producers, and wind and solar owners trade to get the most value from what they produce. Sometimes that means selling output ahead of time at a good price. Other times it means holding some back to sell when prices spike. Renewable asset forecasting helps wind and solar asset owners know what to bid.
Speculators
Banks, hedge funds, and specialized trading firms take positions based on where they think prices are heading, often without owning any physical assets. They provide liquidity, meaning there's almost always someone willing to take the other side of a trade, and they absorb risk that hedgers and asset owners want to hand off. Power markets trading solutions help speculators size and time their bets.
How does energy trading work?
Energy trading happens on exchanges, in private deals between companies, and in wholesale markets run by grid operators. Across all three, traders rely on a handful of standard contract types.
Exchanges are centralized marketplaces, such as NYMEX, ICE, and the European Energy Exchange, where standardized contracts are bought and sold and the exchange guarantees that every trade is honored. Over-the-counter (OTC), or bilateral, deals are negotiated directly between two companies, often through a broker, and their terms can be tailored.
These contracts are the main tools traders use to manage risk.
How do energy traders manage risk?
Energy hedging is the main way traders manage risk. It means using contracts to protect against price risk, volume risk, and basis risk.
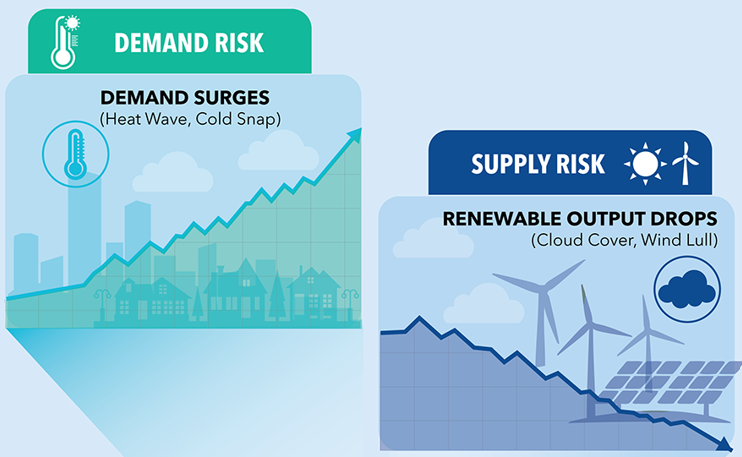
Volume risk can be tricky because it depends on things like weather that can change quickly. A hedge sized for a normal summer can leave a utility exposed during a record heat wave, when it has to buy the extra power at peak prices. That's why accurate demand forecasts sit at the center of load risk management.
Most trading companies keep track of all this in an energy trading and risk management (ETRM) system, software that records every trade, shows where the company stands, and estimates how much it could gain or lose as prices move. An ETRM is only as reliable as the information going into it. If the demand or price assumptions feeding it are off, the risk numbers coming out will be off too. Why Your ETRM Is Only as Good as Its Forecast explains more.
What is renewable energy trading?
Renewable energy trading covers the contracts, certificates, and strategies involved in buying and selling power from wind, solar, and batteries. Because wind and solar output depends so heavily on the weather, it brings unique risks.
Many wind and solar projects sell their output through power purchase agreements (PPAs), long-term contracts with a utility or a large buyer such as a technology company, often for a decade or more. A PPA gives the project steady revenue and the buyer a predictable cost, and the project's RECs are often included in the deal.
However, many renewable asset owners are moving off of PPAs and toward market participation. Renewable asset forecasts help owners decide how much to commit to these markets ahead of time.
Batteries change the economics by storing power when it's cheap, often in the middle of a sunny day, and selling it when prices climb in the evening. Our comparison of battery storage in Texas and California shows how differently that plays out from one market to another.
Virtual power plants take a similar idea further, pooling many small resources like home batteries and smart thermostats so they can act as one, as explained in Virtual Power Plants 101.
Where does forecasting fit into energy trading?
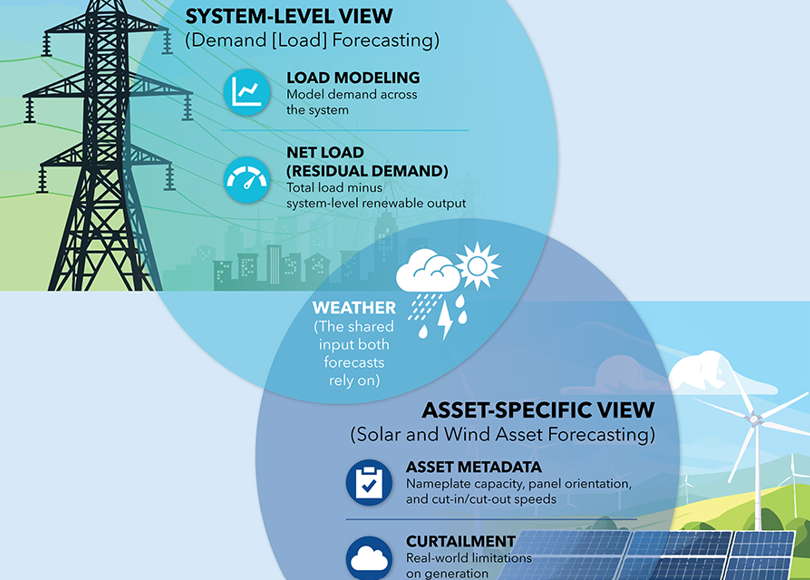
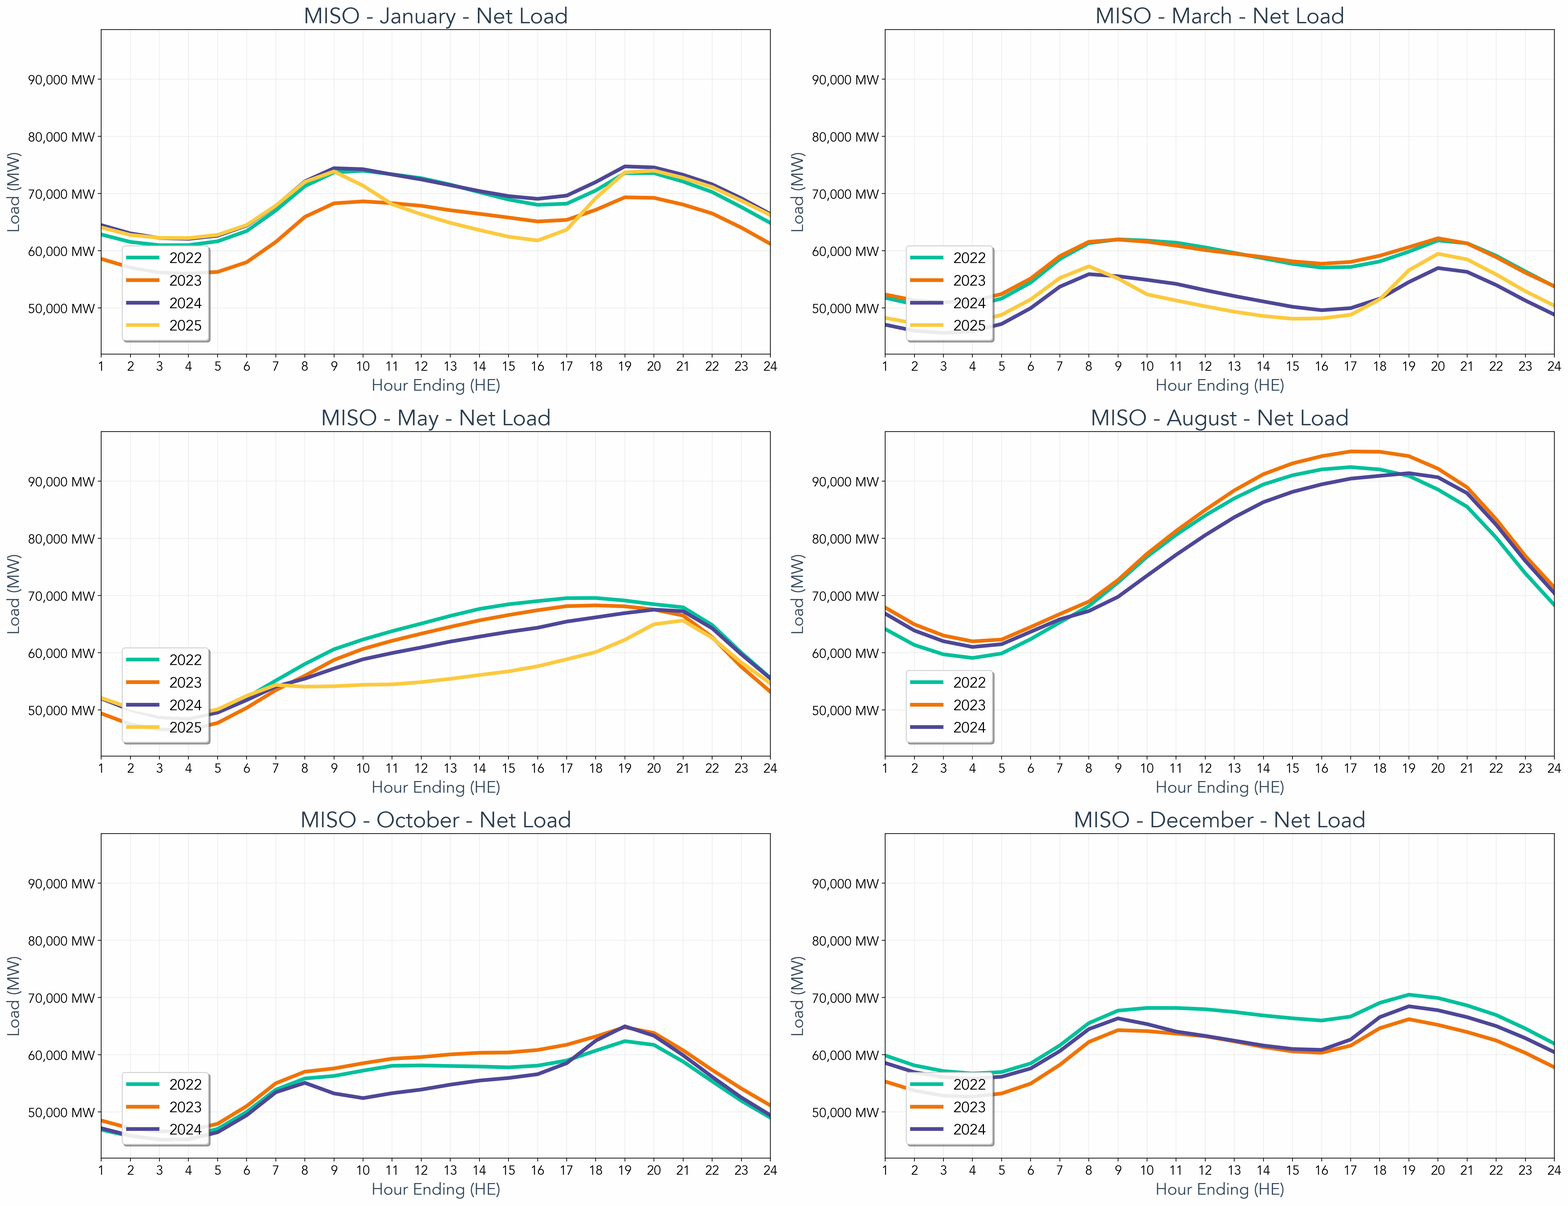
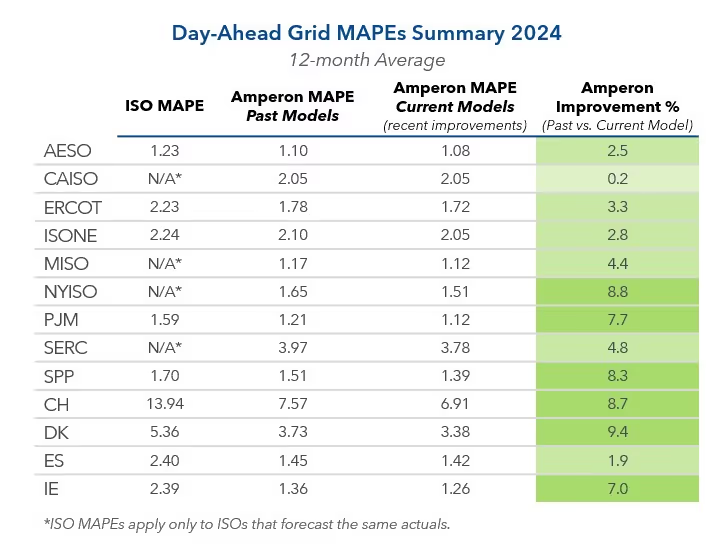
Forecasts of demand, net demand (demand minus wind and solar output), and price feed nearly every hedging and trading decision, in electricity and in the commodities connected to it.
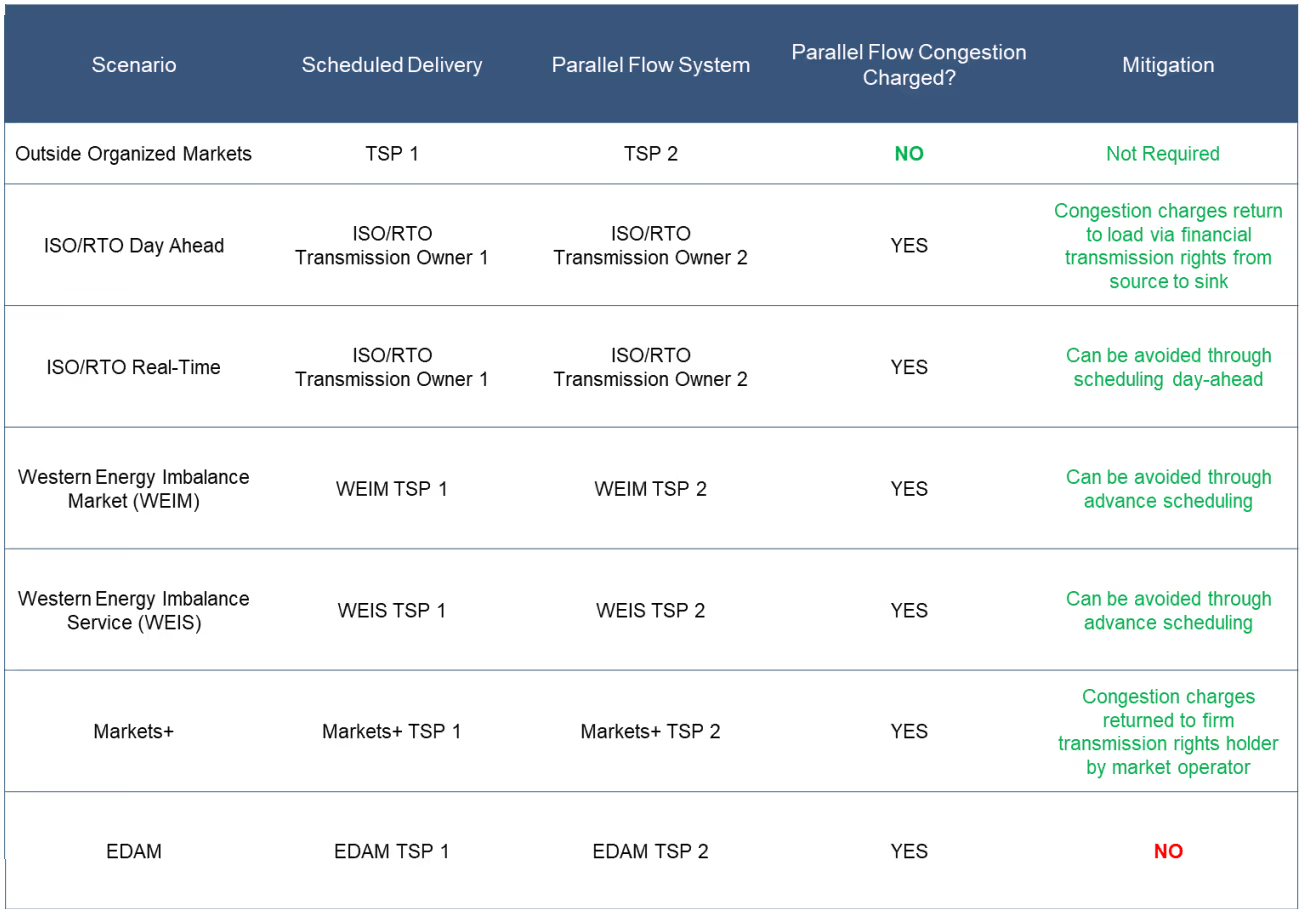
Each risk in the table above comes back to a forecast. Price risk depends on where prices are heading, volume risk depends on how much energy people will use or produce, and both depend on the weather. Because electricity demand drives how much gas power plants burn, a good power demand forecast is a useful signal for gas traders as well. New sources of demand, especially data centers, make those forecasts harder and more valuable at the same time.
Better forecasts shrink volume risk in particular. Shipley Energy has supplied energy since 1929, growing from coal into heating oil, propane, gasoline, natural gas, and electricity. As its electricity business expanded to serve homes and businesses across parts of the eastern and central US, knowing how much power those customers would use became central to managing its risk.
After switching to Amperon's portfolio demand forecast, Shipley cut its forecast error by 40% and saved an estimated $2.3 million, with a clearer view of how much power to buy ahead of time and how much exposure it was carrying.
Good forecasts help traders see risk sooner and more clearly, so they can size their hedges more accurately.
Explore Power Markets Trading Solutions →
Energy trading terms in plain English
Frequently asked questions
What is energy trading?
Energy trading is the buying and selling of energy, such as electricity, natural gas, and oil, along with related products like renewable energy certificates and carbon allowances. Companies trade to protect themselves against price changes, which is called hedging, or to profit from those changes, which is called speculating.
How does energy trading work?
Buyers and sellers agree on prices for energy delivered now or in the future, either on exchanges, through private deals between companies, or in wholesale markets run by grid operators. Most trades use standard contracts such as futures, forwards, swaps, and options, and many settle in cash rather than through physical delivery.
What is the difference between energy trading and power trading?
Energy trading is the broad category, covering electricity, natural gas, oil, environmental commodities, and more. Power trading focuses on electricity alone. Our Power Trading 101 guide covers it in detail.
What is energy hedging?
Energy hedging is using contracts to protect against unwanted changes in energy prices or volumes. A utility might buy natural gas for next winter at a fixed price today, so a cold snap that sends prices higher leaves its costs unchanged.
What are environmental commodities?
Environmental commodities are tradable certificates and permits tied to clean energy and emissions. The most common are renewable energy certificates (RECs), which prove that electricity came from a renewable source, and carbon allowances, which give the holder the right to emit a set amount of greenhouse gases.
What is renewable energy trading?
Renewable energy trading is the buying and selling of power, certificates, and contracts tied to wind, solar, and battery storage. It includes long-term power purchase agreements, REC trading, and strategies for managing weather-dependent output and curtailment.
Explore more
Trading series
- Power Trading 101: How a Power Trading Desk Works
- Why Your ETRM Is Only as Good as Its Forecast
- FTR Trading Strategies in a Changing Grid
- How Weather Impacts Energy Demand & Prices
Renewables
- IPPs Rolling Off PPA: 5 Best Practices for Market Participation for Wind and Solar Assets
- Virtual Power Plants 101: How They Work and Why Forecasting Accuracy Matters
- US Solar and Wind Curtailment Is Exploding
- Battery Energy Storage: ERCOT vs. CAISO