Product Launch
New Product Alert! Grid Demand Mid-Term Forecasting
Learn More

How the Grid Changed in 2024

From plant retirements, new generation projects, the rapid expansion of battery storage, growing demand, and record-breaking capacity prices – 2024 had it all.

Arianna Goldstein and Cameron Odegaard
February 26, 2025

Summary

1
2
3
4

From plant retirements and new generation projects to the rapid expansion of battery storage and growing demand to record breaking capacity prices – 2024 had it all. The years ahead will be pivotal, with even more transformation on the horizon. Below, we will break down some of the changes we saw this past year by ISO.  

PJM

PJM’s grid underwent significant changes in 2024, with things like solar generation growth, plant retirements, soaring capacity prices, and increasing demand.

One of the most notable retirements was the Homer City coal plant. The final 626 MW of the plant was removed this past April. Thankfully, the PJM grid still survived the sweltering summer without this coal plant in the thermal stack.  

The 2025/2026 PJM capacity auction marked another major shift for the region, and the results made one thing clear, prices did not respond well to recent retirements. PJM Capacity Auction Prices soared to unprecedented levels. The main reasons for this? Demand growth, plant retirement causing supply and demand issues, and a lagging interconnection queue.  

But another major factor was also co-location. This past year, co-location became a hot topic as data centers sought ways to integrate into the grid more efficiently. While some viewed it as a strategy to navigate system constraints, it also contributed to the growing strain on capacity.

The good news is regulators are reevaluating market rules to help bring capacity prices down in the future. However, relief in the short term appears unlikely. The coming years will determine just how much these reforms accelerate the interconnection process and ease pricing pressures.

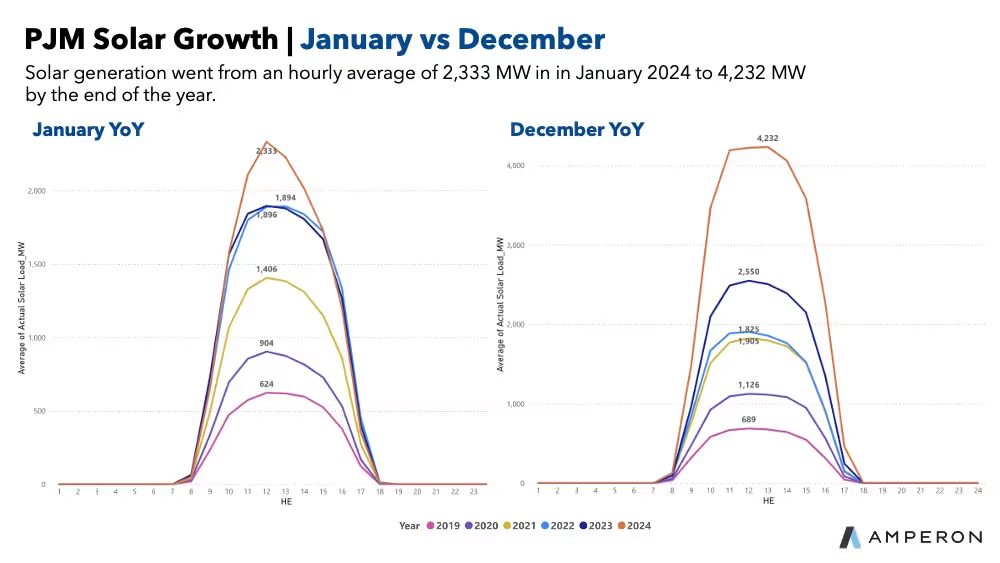
PJM also saw significant solar growth in 2024, adding at least 2.5 GW over the past year. At the start of the year, the region’s maximum solar record output was just under 5.4 GW. By year’s end, it had surged to 8 GW. This was a monumental leap that highlights how quickly solar is being added to the grid.

Dual line charts showing PJM solar growth from January to December 2024, with hourly average increasing from 2,333 MW in January (peak 2,515 MW) to 4,232 MW by December (peak 4,232 MW) across years 2019-2024

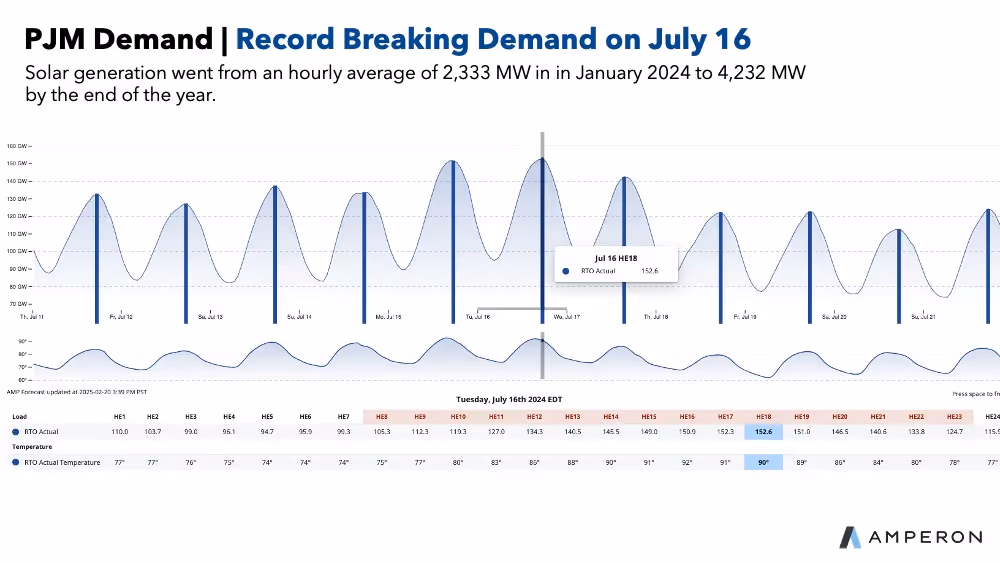
With these changes, PJM also experienced record-breaking summer demand. The system operator had forecasted a peak of, 151,254 MW, but actual demand exceeded expectations, reaching 152.55 GW on July 16th. This day was a true scorcher.

Chart showing PJM demand with record-breaking peak on July 16, displaying solar generation increase from 2,333 MW in January 2024 to 4,232 MW by year-end, with detailed hourly data and temperature readings for July 16, 2024 at HE18 (152.6 GW at 90°F)

ERCOT

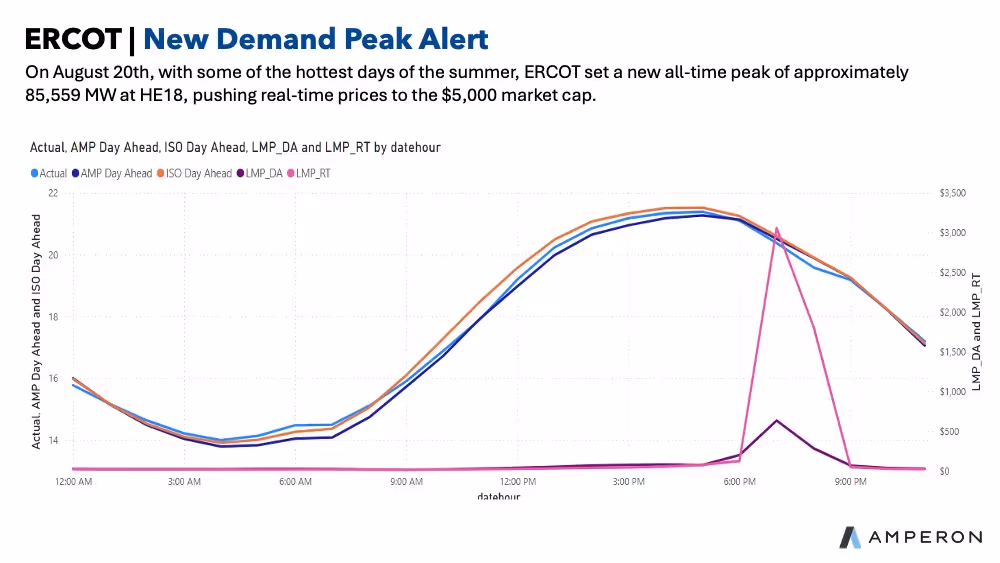
New demand peak alert! This past summer, ERCOT demand soared to new heights (the limit does not seem to exist!). On August 20th, ERCOT set a new all-time peak of approximately 85,559 MW at HE18, surpassing the previous record of 85,508 MW set last August. This surge was driven by some of the hottest temperatures of the summer and continued load growth, pushing real-time prices to the $5,000 market cap.

Chart showing ERCOT new demand peak alert on August 20th with approximately 85,559 MW at HE18, displaying actual load versus multiple Amperon forecasts and LMP prices reaching $5,000 market cap

Beyond record demand, 2024 was a huge year for solar and battery storage in ERCOT. At the start of the year, the solar peak record stood at 14.8 GW, supplying 23% of the Texas grid’s demand at the time. By year’s end, solar peak records surpassed 21 GW, a massive leap.

Battery storage followed a similar trajectory. Early in 2024, battery peak output was 3.2 GW, climbing to 4.3 GW by December. According to the December 2024 EIA 860 Inventory report, ERCOT closed out the year with 7.4 GW of total battery storage capacity, with 3.8 GW added in 2024 alone.

With these numbers, ERCOT is edging closer to CAISO’s renewable dominance. If this trend continues, we could eventually see days where renewable generation supplies 100% of ERCOT’s demand for multiple hours at a time.

MISO

Like PJM, MISO experienced significant shifts in 2024, from rising Energy Market Auction prices to an explosive increase in solar generation.

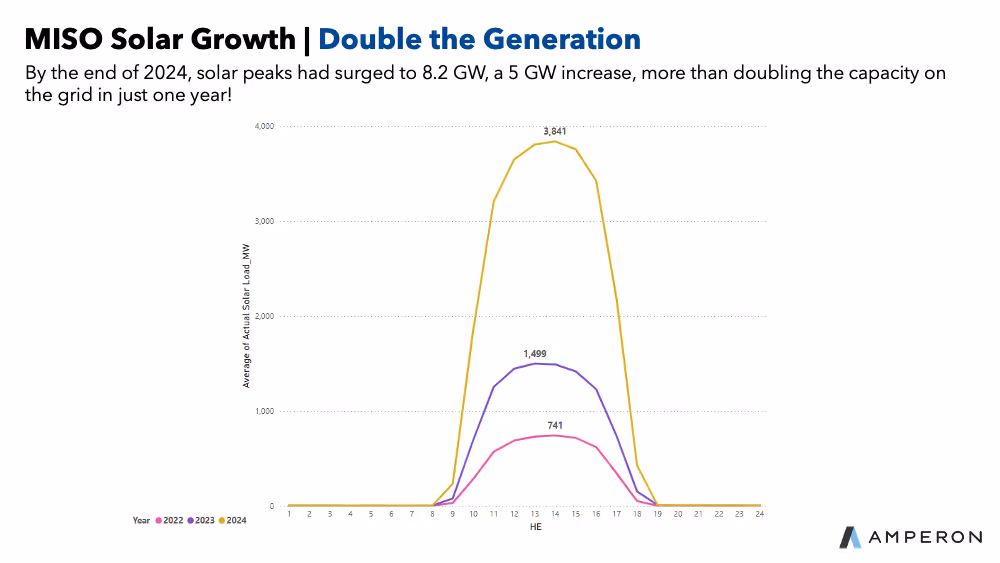
At the start of the year, MISO’s maximum solar generation consistently hovered just below 3.3 GW. By the end of 2024, solar peaks had surged to 8.2 GW, a 5 GW increase, more than doubling the capacity on the grid in just one year!

Line graph showing MISO solar growth titled "Double the Generation" with peaks surging to 8.2 GW by end of 2024, representing 5 GW increase and more than doubling capacity, comparing 2022, 2023, and 2024 with peak at 3,841 MW

While MISO’s capacity price increases were not as dramatic as PJM’s, trends suggest a similar trajectory in the coming years. Some zones saw stable clearing prices, while others, like Zone 5, cleared much higher, due to coal plant retirements, rising demand, and supply and demand issues. These price spikes were particularly pronounced in spring and Fall when seasonal demand is lower and generation outages peak.

Additionally, according to the EIA-860 Monthly Electric Generator Inventory, coal plant retirements dominated MISO’s grid changes in 2024.

South Oak Creek Unit 5 & 6 (299 MW each) finally retired May 2024 after going through a few delays. Units 7 & 8 (about 300 MW each) are expected to retire in 2025.  

Rush Island Coal Plants units 1 & 2 (totaling 1,178 MW) officially retired in October of 2024, shortly after MISO hit its summer peak demand of 121.6 GW on August 26th. This upcoming summer will be the first without Rush Island’s 1.1 GW of capacity, which could drive higher capacity auction prices and potential supply concerns.

EIA chart and pie graph showing U.S. planned utility-scale electric generating capacity retirements for 2024, totaling 5.2 GW with coal (45%, 2.3 GW), natural gas (46%, 2.4 GW), petroleum (9%, 0.4 GW), with major retirements scheduled for June-July
Source: eia.gov

ISONE & NYISO

In 2024, ISONE bid farewell to the Mystic Combined Cycle Power Plant, a 1,403 MW facility that officially retired in June. As one of the oldest power plants in the country, its shutdown marked the end of an era.

While grid growth remained modest, ISONE’s interconnection queue surged, with approximately 40,000 MW of proposed capacity, an overwhelming 97% of which is renewable energy and battery storage. By the end of 2024, renewables made up 12% of ISONE’s total generation, a number expected to rise in the coming years.

The Vineyard Wind offshore project had a milestone-filled but turbulent year. Once completed, the large-scale wind farm is expected to generate enough clean energy to power 400,000 homes in the region. At the beginning of 2024, the project added five turbines to the grid, producing 68 MW of electricity. This number soon grew to ten turbines before progress was abruptly halted in July when a turbine blade fell into the ocean. The incident led to a month-long pause in both energy production and construction. While construction has since resumed, energy production remains suspended, with the working turbines not yet supplying power to the grid. As 2025 approaches, major developments are expected for this 800 MW wind farm. Additionally, 219 MW of solar generation and 239 MW of battery storage is also expected to come online in the coming year.

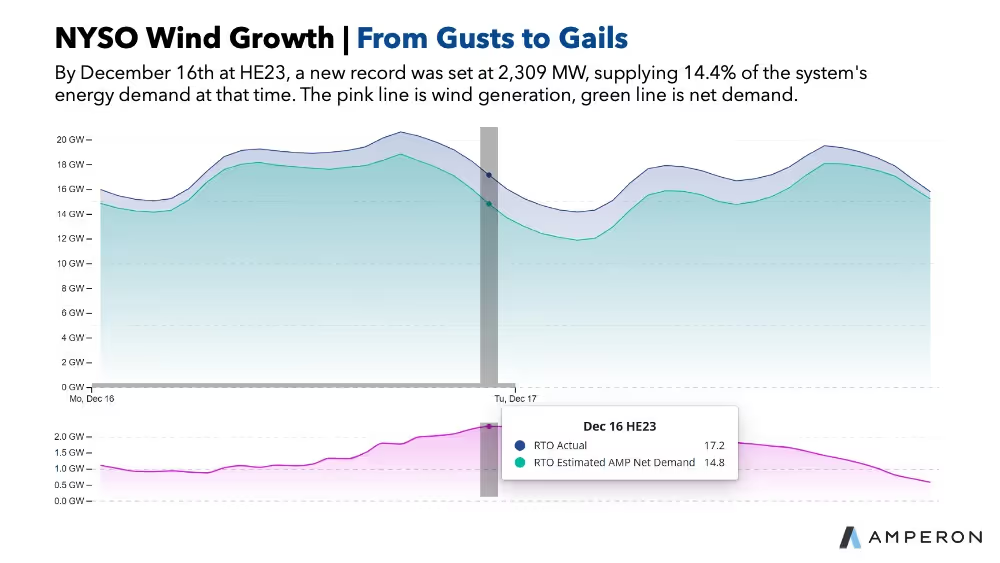
In 2024, NYISO repeatedly broke records for wind generation. At the start of the year, the grid reached 2,176 MW of wind generation in a single hour. By December 16th at HE23, a new record was set at 2,309 MW, supplying 14.4% of the system's energy demand at that time. While these figures may not be as large as those in other ISOs, they signal a strong trend toward future growth, with exponential expansion on the horizon.  

Stacked area chart showing NYSO wind growth titled "From Gusts to Gails" with wind generation record of 2,309 MW at HE23 on December 16, supplying 14.4% of system demand, displaying wind generation (pink) and net demand (green/blue)

CAISO

This past year, CAISO saw huge shifts in its grid with renewables taking center stage and the market evolving rapidly. First, solar generation soared, setting a new record of 19,650 MW on August 23, frequently pushing CAISO into net exporter mode during the day.

Line graph titled "CAISO Solar Growth: Breaking New Generation Records" showing solar generation record of 19,650 MW on August 23, 2024, comparing years 2022, 2023, and 2024 with battery storage doubling from previous year

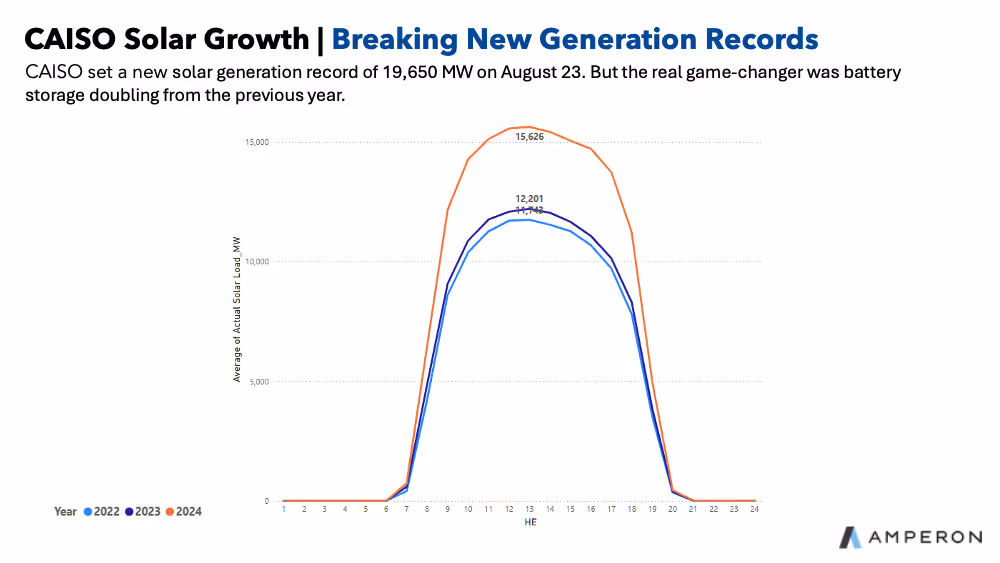
Wind also held steady, but the real game-changer was battery storage growing by 4.19 GW in 2024, nearly doubling the 2.68 GW added the previous year. By year-end, total battery capacity reached 11,454 MW, up from just 4,515 MW at the end of 2022 – a massive shift in how the grid manages renewables.

But it was not all smooth sailing. California’s energy needs kept growing with peak demand for the year reaching 48,323 MW on September 5 – one of the highest in recent years (though short of 2022's record of 52,061 MW). Transmission congestion led to price swings, especially with large deltas in SP15 and NP15 during the midday driven by south-north energy flows. This spring saw record breaking negative pricing which was a result of renewable curtailments hitting an all-time high. The new monthly record was set at 839,582 MWh curtailed in April as excess solar flooded the system.

Despite challenges, CAISO avoided Flex Alerts all year, showing that storage, imports, and better forecasting kept things stable even in tight conditions. By year-end, renewables continued expanding, further shifting California’s grid toward a more storage-driven and intermittent-resource-heavy system.

SERC

SERC experienced two major changes this year which marked the ending of one chapter and the beginning of another. The 626 MW Seminole Electric Cooperative Coal Plant Unit 1 saw its final days on the grid and was officially retired. Meanwhile, Vogtle Nuclear Power Plant Unit 4 began commercial operation, joining Unit 3 in the generation stack for the first time.  

With each new unit adding 1,114 MW of capacity, Vogtle is now the largest nuclear power plant in the United States, with a total capacity nearing 5 GW. Notably, this expansion provides carbon-free energy, playing a key role in Georgia’s emissions reduction efforts.

SPP

This past year, SPP saw major shifts in its market, shaped by lower gas prices, evolving generation mixes, and persistent congestion. Natural gas prices averaged between $1.26/MMBtu and $2.25/MMBtu in 2024 – down sharply from $3.33/MMBtu in winter 2023 – driving wholesale power prices lower. Wind remained the dominant generation source, accounting for 30-47% of generation depending on the season, while coal declined, and gas-fired generation increased. At the end of November 2024, wind capacity reached 34,556 MW in nameplate capacity, up 1,200 MW from November 2023.

Chart showing electricity and gas prices from September 2023 to Fall 2024, displaying day-ahead LMP prices, real-time prices in blue bars, and gas cost as green line, with notable price spike in January 2024 reaching $50/MWh
Source: SPP State of the Market

According to the Summer 2024 SPP state of the market, average hourly load for the 2024 summer was 3% above 2023, while the peak hourly load was down 3% compared to 2023. But winter was a mixed bag. While January 2024’s winter storm drove an 15% increase in monthly peak load from the previous year, the average hourly load in winter – and spring – only grew slightly. Nonetheless, system reliability held.  

Congestion remained a challenge. Oklahoma (in fall 2024), North Dakota (in winter 2024), and Kansas City (in spring 2024) all experienced congestion issues primarily attributed to transmission and generation outages, wind impacts, increased local loads, and external parallel flows. Day-ahead congestion costs increased in winter but eased in spring and fall, while market-to-market payments from MISO to SPP rose – highlighting the need for shared resource adequacy across ISOs amid ongoing load growth.

SPP maintained system reliability throughout 2024. By year-end, the market saw increased renewable integration, with wind surpassing coal in the summer for the first time. Coal generation declined across all seasons, while gas generation fluctuated in response to lower fuel prices. Transmission congestion remained a challenge, with constraints occurring in multiple regions. Economic dispatch patterns reflected fuel price shifts, influencing generation trends across the market.

In 2025

It's worth pondering over these regional nuances and their effects on the market. There’s CAISO who was an early adopter of renewables, grappling with the infamous duck curve and the volatility that followed. But 2024 marked a turning point. Thanks to battery storage, grid reliability reached its highest level in years.  

Meanwhile, ERCOT, who has surged ahead as a wind power leader, is now experiencing rising prices and shifts in net demand. Coupled with demand growth, balancing the grid and reliability concerns remain a major issue for them.  

Now, PJM, MISO, ISO-NE, and NYISO are entering the fray. Old power plants are being retired and replaced with renewables. The question is: Can they bypass the growing pains of their predecessors by rapidly deploying batteries to maintain balance? 2025 might be the tipping point for how things go.

Sources:

State of the Market – Winter

State of the Market – Fall

State of the Market – Summer

State of the Market - Spring

Key Statistics Library – CAISO, QX 2024 Report on Market Issues and Performance

AI-driven Forecasting

Our advanced machine learning methodology delivers the accuracy you need to optimize operations and maximize profits.

  • 40K weather points from 4 vendors
  • 15-day short-term forecasts that update sub-hourly
  • Globally available
  • Leading UI/UX or API delivery
Book a demo

Want 3x more accurate forecasts? Let's talk.

Book a demo

Related articles

Left arrow icon for navigationRight arrow icon for navigation
Blog
December 5, 2025
The Pacific Northwest Risks a 6 GW Shortfall This Winter
Open article
Blog
December 5, 2025
With Millions On the Line, Amperon Called Cold Snap 33 Days Out
Open article
Blog
December 5, 2025
Chilean Solar and Wind Asset Owners Face Hourly Reporting Under New Market Structure
Open article
Blog
December 5, 2025
Can PJM Keep Up with Exponential Load Growth?
Open article
Blog
December 5, 2025
US Winter Weather Outlook 2025–2026: Mild on Paper, Volatile in Practice
Open article
Blog
December 5, 2025
Ontario’s Day-Ahead Market is a Renewables Profitability Test
Open article
Blog
December 5, 2025
US Solar and Wind Curtailment Is Exploding
Open article
Blog
December 5, 2025
Navigating the RTC+B Paradigm Shift
Open article
Case study banner reading “Nailing MISO’s Fall 2025 Coincident Peak” with a computer displaying grid demand forecasts
Blog
December 5, 2025
Nailing MISO's Fall 2025 Coincident Peak: A Week-Ahead Perfect Call
Open article
Amperon MTF model visualization displaying market trends and forecasts
Blog
December 5, 2025
Unlocking Intelligent Term Trading and Seasonal Planning  
Open article
Blog post header with palm tree in hurricane winds asking Why Has This Hurricane Season Been So Quiet with Amperon branding
Blog
December 5, 2025
Why Has This Hurricane Season Been So Quiet?
Open article
Table showing parallel flow congestion scenarios across different energy markets including ISO/RTO, WEIM, WEIS, Markets+, and EDAM with scheduled delivery systems and mitigation strategies
Blog
December 5, 2025
CAISO Breaks the Transmission Hedge
Open article
Amperon blog post graphic asking High ERCOT Demand, Low Wind, and No Price Spike? with load forecast chart for August 18, 2025
Blog
December 5, 2025
High ERCOT Demand, Low Wind, and No Price Spike?
Open article
ISONE May hourly average load comparison chart showing data from 2023, 2024, and 2025 with peak loads around 13,534 MW at HE17-18
Blog
December 5, 2025
Electrification and BTM Solar: Reshaping Demand in ISO New England
Open article
Line graph showing MISO Net Load from 2022-2025 comparing hourly load patterns ranging from 50,000 to 90,000 MW across 24-hour period
Blog
December 5, 2025
The Rise of the Duck Curve in ERCOT: A Shift in Net Demand Peak and the Future of Solar Power Integration
Open article
Amperon market analysis titled Where's the Chaos? ERCOT's Surprisingly Quiet Summer with curved line graph showing peak demand trends from 2022-2025
Blog
December 5, 2025
Where’s the Chaos? ERCOT’s Surprisingly Quiet Summer
Open article
Amperon forecasted load versus prediction time by weather vendor chart for PJM on June 24, 2025, showing settled demand at 158.2 GW with multiple vendor forecasts (ENS_1, NBM, DTN, AG2)
Blog
November 18, 2025
PJM Breaks 10-Year Peak Load Record — and Amperon Saw It Coming 7 Days Out
Open article
Blog
June 18, 2025
PJM Forecast: June 23–25 Heat Wave May Shatter Summer Expectations
Open article
Blog
June 11, 2025
ISONE’s First Heat Spike of Summer- and Amperon Nailed It
Open article
Amperon whitepaper cover titled Cost of Uncertainty: The Challenges and Value of Accurate Price Forecasting with download button, dated March 2025
Blog
November 18, 2025
Why Wholesale Electricity Prices are ESPECIALLY Volatile in Texas
Open article
Blog
June 3, 2025
Powering Profitable Growth for Retail Electricity Providers: Turn Load Forecasting into Your Competitive Edge
Open article
Blog
November 18, 2025
Navigating ERCOT’s 4CP Program: Key Updates and Strategic Preparation for 2025
Open article
Amperon promotional banner announcing sub-hourly grid forecasts for European TSOs now available, featuring transmission tower with geometric orange and blue design elements
Blog
November 18, 2025
Europe’s Shift to 15-Minute Power Markets: How Amperon Helps You Prepare for Market Evolution
Open article
Amperon blog post graphic titled "The Shape Shift: How Texas Net Demand Transitions from Shoulder to Summer" with wind turbine image
Blog
November 18, 2025
The Shape Shift: How Texas Net Demand Transitions from Shoulder to Summer
Open article
Amperon presentation slide titled "ERCOT's Evolving Price Dynamics 2021-2024 Analysis" with sunset transmission tower image
Blog
November 18, 2025
ERCOT’s Evolving Price Dynamics [2021-2024 Analysis]
Open article
A promotional image announcing the introduction of real-time grid price forecasts now live in ERCOT, featuring Amperon branding
Blog
November 18, 2025
Amperon Expands Forecasting Capabilities with Real-Time Price Predictions in ERCOT
Open article
Blog
November 18, 2025
MISO’s VOLL Change Could Reshape Scarcity Pricing and Reliability Signals
Open article
Blog
November 18, 2025
Why Behind-the-meter Solar Complicates Spring Forecasting
Open article
Comparison table showing solar and wind forecasting capabilities across Machine Learning, Physics-based, and Amperon (ML+PB) approaches for partial asset metadata, soiling, equipment degradation, biased weather, and curtailment
Blog
November 18, 2025
How to Forecast Energy Generation for Wind or Solar Assets
Open article
Day-ahead grid MAPE summary table for 2024 showing 12-month average comparison of ISO MAPE, Amperon MAPE past models, current models, and improvement percentages across multiple ISOs (AESO, CAISO, ERCOT, ISONE, MISO, NYISO, PJM, SERC, SPP, CH, DK, ES, IE)
Blog
November 18, 2025
Always Innovating: Amperon’s New Techniques to Improve Energy Forecasting
Open article
Amperon recap slide for April 7 titled "Why prices in ERCOT soared to $4000 per MW" with pastoral field landscape at golden hour
Blog
November 18, 2025
High Net Demand and Outages Caused Recent Price Spike in ERCOT
Open article
Amperon ebook promotional banner "Price Forecasting: Cost of Uncertainty - The Challenges and Value of Accurate Price Forecasting" with free ebook download button on gradient blue-green background
Blog
November 18, 2025
Are ERCOT’s morning ramp DA prices really higher than summer?
Open article
Infographic titled "Types of Data Relevant to Both Solar and Wind Assets" showing three categories: Nameplate Capacity, Location of Asset, and Historic Curtailment with wind turbines and solar panels imagery
Blog
November 18, 2025
Inside our Data: Intro to Renewable Asset Data
Open article
Amperon promotional slide "Adapting to OMIE's 15-Minute Transition: How Granular Forecasts Can Help You Stay Ahead" with laptop showing asset-level solar sub-hourly forecast for January 12, 2025
Blog
November 18, 2025
Adapting to OMIE’s (Portugal and Spain) 15-Minute Transition: How Granular Forecasts Can Help You Stay Ahead
Open article
Blog
November 18, 2025
What the beginning of daylight savings time means for peak pricing
Open article
Amperon presentation slide "How the Grid Changed in 2024" with aerial view of large-scale solar farm installation in agricultural setting at sunset
Blog
November 18, 2025
How the Grid Changed in 2024
Open article
Amperon recap slide for February 14-20 titled "Another cold week on the grid, another good week for Amperon's demand forecasts" with wind turbines in snowy landscape
Blog
November 18, 2025
Another cold week on the grid, another good week for Amperon’s demand forecasts
Open article
Blog
November 18, 2025
The Future of Western Power Markets: Why Implementing a Day-Ahead Market Matters
Open article
Blog
November 18, 2025
Harnessing the power of sub-hourly and hourly forecasts for wind assets
Open article
Blog
November 18, 2025
Forecasting for the Super Bowl: How much does the big game really affect demand?
Open article
Amperon promotional banner stating "33% more accurate in MISO" with blue gradient background and solar panels with wind turbines imagery
Blog
November 18, 2025
Best Demand and Net Demand Forecasting Calls to End 2024
Open article
Amperon slide featuring Punxsutawney Phil prediction reference titled "What Punxsutawney Phil's prediction for 6 more weeks of winter really means for the grid" with snowy groundhog image
Blog
November 18, 2025
What Punxsutawney Phil’s prediction for 6 more weeks of winter really means for the grid
Open article
Blog promotional graphic on navy background titled "New Blog: Why a hybrid regression/ML approach outperforms in energy forecasting" with layered visualization showing Linear Regression, Boosted Trees, and Additional secondary models
Blog
November 18, 2025
Why a hybrid regression/ML approach outperforms in energy forecasting
Open article
Blog
June 3, 2025
Europe 2024 Best Amperon Forecasting Calls and Trends to Watch
Open article
Title slide reading "Part 1: Inside Our Data: The Importance of Granular Weather Data" by Lily Bowdler from Amperon
Blog
November 18, 2025
Inside our Data: The Importance of Granular Weather Data
Open article
Bar chart showing 2025 Highest ISO Demand Levels So Far across four ISOs: ERCOT (68.9 GW), PJM (126.8 GW), MISO (97.9 GW), and SPP (43.1 GW)
Blog
November 18, 2025
Déjà vu? With one cold snap down, will we have a repeat of last MLK weekend?
Open article
Blog promotional slide "The first winter cold snap is here, but will it break records?" with laptop displaying PJM weather data showing 5-year, 10-year, and 30-year normals for various cities
Blog
November 18, 2025
First winter cold snap is here, but will it break records?
Open article
Blog
June 3, 2025
Looking Back (and Ahead): A Year-end Q&A with Amperon CEO Sean Kelly
Open article
Line graph comparing Ireland Wind Generation forecasts for August 20-26, showing Actual Wind, Amperon Day Ahead Wind Forecast, and EirGrid Day Ahead Wind Forecast (duplicate of image 43)
Blog
November 18, 2025
How strong winds in Ireland left power market stakeholders exposed
Open article
Line graph of CAISO demand for Indigenous Peoples Day 2024 (October 11-14), showing Duck Curve pattern and comparing Amperon Day Ahead, ISO Day Ahead, and Actuals
Blog
November 18, 2025
Forecasting for the holidays: How holidays affect demand patterns
Open article
Blog
June 3, 2025
When tech buys nuclear, who wins?
Open article
Blog
November 18, 2025
Unlocking new standards in solar forecasting to maximize asset efficiency
Open article
Marketing graphic titled "What's Happening with Price Forecasting? A Q&A with Amperon CEO Sean Kelly" featuring professional headshot of Sean Kelly
Blog
November 18, 2025
What’s Happening with Price Forecasting? A Q&A with Amperon CEO Sean Kelly
Open article
Blog
November 18, 2025
Taking Advantage of Amperon’s Net Demand Forecast on Snowflake
Open article
Line graph showing ES (Spain) Demand for August 15 Feast of Assumption, with table comparing Peak Demand, Amperon APE, and ES APE percentages across four dates, plus lower panel showing electricity production and spot prices
Blog
November 18, 2025
2024 Energy Demand Trends: What Happened During 3 Recent EU Holidays
Open article
Blog
June 3, 2025
PJM Capacity Auction: Record Pricing and Delays
Open article
Multi-panel visualization showing ERCOT Demand for July 1-5, including line graphs comparing Amperon and ERCOT forecasts, data tables showing MAPE percentages for different dates, and gauge charts showing average MAPE (1.02% AMP, 1.69% ISO)
Blog
November 18, 2025
Amperon’s best energy forecasting calls for Summer 2024
Open article
Marketing text overlay on transmission tower background stating "Amperon's new price forecast tackles ERCOT's volatility and helps market participants mitigate risks"
Blog
November 18, 2025
Amperon’s new price forecast tackles ERCOT’s volatility and helps market participants mitigate risks
Open article
Marketing graphic announcing "Expanding Amperon's coverage on Snowflake" for Demand and Net Demand across North America and Europe ISO/TSOs, featuring screenshot of Snowflake marketplace interface
Blog
November 18, 2025
Expanding Amperon’s coverage on Snowflake: Demand and Net Demand for North America and Europe ISO/TSOs
Open article
Video thumbnail from webinar titled "Powering Data-Driven Decisions: Enhance Your Energy Trading Game with Amperon + Snowflake" featuring Amperon and Snowflake logos, dated September 26, 2024, with transmission tower image and video progress indicator show
Blog
November 18, 2025
Powering Data-Driven Decisions: Enhance your energy trading game with Amperon & Snowflake
Open article
Photograph of single wind turbine on hilltop with autumn-colored foliage in foreground against clear blue sky
Blog
November 18, 2025
Analysis of spring curtailments in preparation for fall
Open article
Marketing graphic announcing "Introducing Asset-Level Wind Short-Term Forecasts" with photograph of wind turbines against mountain landscape backdrop
Blog
November 18, 2025
Expanding generation forecast capabilities into wind
Open article
ERCOT West Zone Net Demand Short-Term Forecast for August 11-13, 2024, showing three stacked area graphs for Net Demand, Solar Generation, and Wind Generation, with explanatory text about negative net load, curtailments, and congestion implications
Blog
November 18, 2025
Granular insights from grid net demand forecasts: Importance of zone-level forecasting
Open article
Blog
December 2, 2025
Why solar forecasts and accuracy metrics are a big deal
Open article
Satellite view from space showing large hurricane system with visible eye wall approaching Caribbean islands, showing Earth's curvature against black space background
Blog
November 18, 2025
Weaker hurricane season due to Saharan dust
Open article
Close-up photograph of solar panel array showing dust, dirt, and debris accumulation on photovoltaic panel surfaces, demonstrating need for maintenance
Blog
November 18, 2025
Hailstorms: How they can impact your solar farm
Open article
Nighttime satellite image showing hurricane system with well-defined spiral structure making landfall on southeastern United States coastline with visible city lights
Blog
November 18, 2025
Forecasting for SERC During Tropical Storm Debby
Open article
Photograph of dark chalkboard filled with mathematical equations, formulas, and diagrams including algebraic expressions, chemical structures, geometric drawings, and calculus notations written in white chalk
Blog
November 18, 2025
The different kinds of forecasting metrics
Open article
Blog
November 18, 2025
Amperon’s industry-leading forecasts now available to transact on the Microsoft Azure Marketplace
Open article
Aerial photograph of wind farm installation with three large white wind turbines on rolling green hills with mountains in background and scattered buildings in rural landscape
Blog
November 18, 2025
Reminiscing on the summer’s heat waves... so far
Open article
Marketing graphic announcing "Introducing Solar Sub-Hourly Generation Forecasts" with photograph of solar panel installation on ground-mounted framework in grassy field
Blog
November 18, 2025
Harnessing sub-hourly solar forecasts for power markets trading
Open article
Blog
November 18, 2025
Amperon’s methodologies: AI-powered forecasting for the energy transition
Open article
Blog
June 3, 2025
The Double-Edged Sword: Using LLMs in Electricity Market Forecasting
Open article
Satellite image of two tropical cyclone systems near Asian coastline showing clear hurricane eyes and spiral cloud formations over ocean waters with land mass visible on left side
Blog
November 18, 2025
Advanced stress testing for extreme weather
Open article
Blog
June 3, 2025
Enabling Amperon’s short-term grid forecast with Snowflake
Open article
Upward angle photograph of tall electrical transmission tower structure against blue sky with white clouds, showing multiple levels of power line connections and lattice framework construction
Blog
November 18, 2025
Amperon’s best forecasting calls this Spring
Open article
PJM heat wave peak demand forecast comparison table showing Amperon APE vs PJM APE for June 18-23
Blog
November 18, 2025
PJM Heatwave Analysis: Forecasting for 90-degree heat and a new federal holiday
Open article
Seattle city skyline at night featuring the Space Needle with illuminated buildings
Blog
November 18, 2025
A deep dive into what happened MLK weekend in the Pacific Northwest and West Coast
Open article
30-year temperature normals table showing forecasts for cities from Newark to Rockford, June 12-26
Blog
November 18, 2025
June 2024 heat wave - PJM
Open article
Houston demand chart showing May 16 power outage affecting 1 million people with Amperon's weather actuals vs actual load
Blog
November 18, 2025
Storm Analysis: ERCOT’s intense may weather
Open article
Amperon blog header image asking "What is the true carbon impact of your renewable assets?" with solar panels and wind turbines
Blog
November 18, 2025
What is the true carbon impact of your renewable assets?
Open article
White electric fan with yellow and blue ribbons blowing against bright yellow background
Blog
November 18, 2025
Record summer heat is coming, is the grid – and your company – prepared?
Open article
Blog
June 3, 2025
The Western Interconnection’s big day-ahead decision
Open article
Amperon promotional banner introducing Ensemble Forecast and Advanced Weather Package with laptop display
Blog
November 18, 2025
Introducing Amperon's Ensemble Forecast, NBM Integration, and Advanced Weather Package
Open article
Aerial view of large-scale solar panel farm with organized rows in rural landscape
Blog
November 18, 2025
Coincident peak season is coming
Open article
Desert landscape with red sand, sparse vegetation, and blue cloudy sky
Blog
November 18, 2025
WRAP: New forecasting requirements for Western states’ resource adequacy coalition
Open article
Magnifying glass on business charts and graphs with eyeglasses, representing data analysis
Blog
November 18, 2025
Amperon’s 6 best forecasting calls in 2024 so far
Open article
Power transmission towers and lines crossing snow-covered winter landscape under blue sky
Blog
November 18, 2025
How stable is our grid?
Open article
Total solar eclipse showing sun's corona around dark moon disc against black sky
Blog
November 18, 2025
How the solar eclipse will affect grid stability
Open article
Blue ethernet cable with US hundred dollar bills representing energy cost savings and electricity pricing
Blog
November 18, 2025
The economics of the clean energy transition
Open article
Blog
June 3, 2025
How weather impacts energy demand & prices
Open article
Groundhog (marmot) standing on snow looking alert, associated with weather prediction tradition
Blog
November 18, 2025
How Punxsutawney Phil’s predictions affect the energy grid
Open article
Blog
November 18, 2025
Navigating error measurements for wind and solar generation - the case for cnMAE
Open article
Blog
June 3, 2025
Unlocking solar generation insights with Amperon's renewable forecasts
Open article
Blog
June 3, 2025
Amperon's 2023 Recap
Open article
Blog
June 3, 2025
Morning Ramp Ups and Weather Misses: ERCOT Winter Storm Recap
Open article
Blog
June 3, 2025
Cold Winter Storm Could Bring Trouble to ERCOT
Open article
Blog
June 3, 2025
The Duck Curve and Utilities’ Emerging Seasonal Risks
Open article
Blog
June 3, 2025
Why Advanced Forecasting is Needed for a Solar Powered Future
Open article
Blog
June 3, 2025
Amperon Launches in SERC
Open article