There are three power grids in the United States: the Eastern Interconnection, the Western Interconnection, and because Texas is special, ERCOT.
What is ERCOT?
ERCOT, the Electric Reliability Council of Texas, is the independent system operator (ISO) covering most of Texas. That means it manages the wholesale market that supplies power to more than 27 million customers, covering about 90% of the state's electric load.
Three things make ERCOT different from every other U.S. power market:
- It is an energy-only market. There is no capacity market. Generators earn revenue mainly from selling energy and ancillary services, particularly during price spikes.
- It is mostly islanded. ERCOT has only limited connections to the rest of the U.S. grid, so it cannot lean heavily on imports when supply runs short.
- It is regulated by Texas, not FERC. Because ERCOT's grid does not cross state lines, the Public Utility Commission of Texas (PUCT) and the Texas Legislature oversee it.
These traits have allowed ERCOT to move quickly, adding massive amounts of new generation while keeping interconnection queues relatively favorable. For example, a solar project in Texas has to wait roughly half the amount of time to connect to the grid that it would in California.
These traits have allowed ERCOT to move quickly, adding massive amounts of new generation while keeping interconnection queues relatively favorable.
The inevitable downside is that ERCOT prices are generally more volatile than in other U.S. power markets. In fact, ERCOT deliberately allows prices to spike dramatically (up to a cap of $5,000/MWh) in order to reward technologies like battery energy storage that can respond quickly to grid stress.
The inevitable downside is that ERCOT prices are generally more volatile than in other U.S. power markets.
Even in the face of volatility, Texas power demand is growing quickly as data centers, industrial activity, and various other ERCOT load growth drivers reshape the market. This adds even more uncertainty for market participants. This guide explains how ERCOT works, what’s changing, and where to find Amperon's deeper analysis on each topic.
ERCOT at a glance
Last updated: October 2026
Sources: ERCOT, ERCOT hubs and load zones, Amperon on the 91.1 GW record, Amperon on battery storage, Amperon on Texas price volatility, Amperon ERCOT load growth report.
ERCOT today: what's changed recently
Last updated: October 2026
ERCOT's demand growth is among the most sustained and broad-based of any major U.S. power market, and the market rules are changing to keep up. Recent developments include:
- Demand broke 90 GW for the first time. ERCOT hit a record 91.1 GW on July 22, 2026, well above the previous record of 85.6 GW set in 2024. ERCOT's own day-ahead forecast called for 89 GW. Amperon's day-ahead forecast had a MAPE of 0.32% that day, compared with 2.31% for ERCOT's forecast. Read the analysis.
- RTC+B went live in December 2025. Real-Time Co-optimization plus Batteries now procures energy and ancillary services together every five minutes and models batteries as single resources. What RTC+B means for market participants.
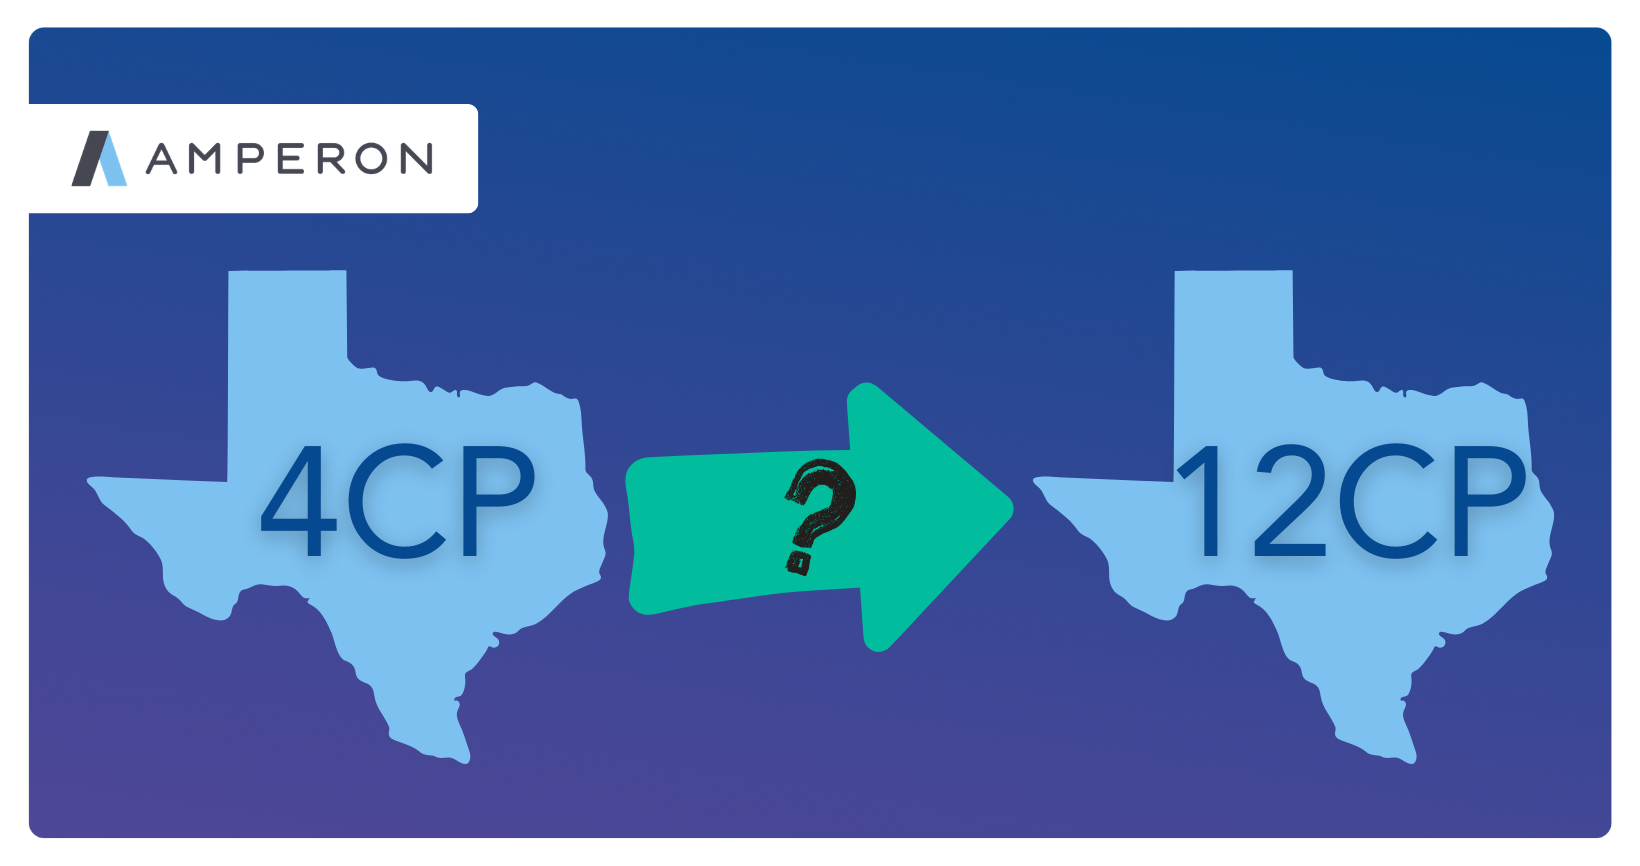
- 4CP is likely being replaced by 12CP. The PUCT published its 12CP proposal (Project No. 58000) in July 2026. Senate Bill 6 requires the PUCT to update its rules by December 31, 2026. The start date for 12CP measurement is not set, but 2027 or later is likely. Why Texas is moving from 4CP to 12CP.
- Battery storage keeps scaling. ERCOT's latest resource adequacy outlook shows about 20.9 GW of batteries, up from 3.2 GW at the start of 2024. ERCOT vs. CAISO battery storage.
- Average daily load is up 45.5% since 2014. It rose from 931 GWh/day in 2014 to 1,355 GWh/day in 2025, and annual growth roughly doubled, from about 2.5% (2014–2019) to about 5.4% (2020–2025). Population growth, industrial demand, and data centers are driving the increase. Download the ERCOT Load Growth & Market Transformation report.
- Data centers are adding load fast. About 7.7 GW of data center and large compute load is already active in ERCOT, another 7.5 GW is expected to come online in 2025–2026, and ERCOT's queue holds about 136 GW of large-load requests. Source: ERCOT Load Growth & Market Transformation report.
- 2025 set a record for new generation. About 14.6 GW reached commercial operation, including 5.7 GW of batteries. Source: ERCOT Load Growth & Market Transformation report.
How the ERCOT market works
ERCOT runs an energy-only, nodal wholesale market with a day-ahead market and a real-time market. Prices are set at thousands of points on the grid, called nodes, and rolled up into trading hubs and load zones for most trading and settlement.
An energy-only market
Most U.S. power markets, including PJM, MISO, and ISO-NE, pay generators separately for being available through a capacity market. ERCOT does not.
Most U.S. power markets, including PJM, MISO, and ISO-NE, pay generators separately for being available through a capacity market. ERCOT does not.
Generators recover their costs mainly through energy prices, so the market relies on occasional high prices during tight supply to signal when new generation is needed. That design is the main reason ERCOT prices are more volatile than prices elsewhere. See Why wholesale prices are especially volatile in Texas.
Day-ahead and real-time markets
- Day-ahead market (DAM): A voluntary financial market that clears the day before the operating day. Participants buy and sell energy and ancillary services for each hour, locking in prices and hedging against exposure to real-time price swings.
- Real-time market (RTM): ERCOT dispatches generation every five minutes to balance supply and demand as it happens. Differences between day-ahead positions and real-time outcomes settle at real-time prices.
RTC+B: real-time co-optimization plus batteries
In December 2025, ERCOT launched Real-Time Co-optimization plus Batteries (RTC+B), the biggest market redesign since ERCOT moved to a nodal market. RTC+B co-optimizes energy and ancillary services every five minutes and models batteries as single resources with a state of charge. Navigating the RTC+B paradigm shift covers what changed and what it means for market participants.
Ancillary services
Ancillary services are reserves ERCOT holds to keep the grid stable when supply and demand don't match. ERCOT procures five main products:
Source: ERCOT Ancillary Services handout. For how Regulation Down participation affects renewable assets, see How frequency regulation is breaking traditional solar and wind forecasts.
Price cap and scarcity pricing
ERCOT's system-wide offer cap is $5,000/MWh, compared with roughly $1,000/MWh in most other U.S. markets. Prices can also fall to $0/MWh or go negative when wind and solar output is high and demand is low.
ERCOT's system-wide offer cap is $5,000/MWh, compared with roughly $1,000/MWh in most other U.S. markets.
Scarcity pricing, now driven by the ancillary service demand curves under RTC+B, pushes prices up further as reserves get thin. This acts as an alternative to capacity markets, adding incentives for generators to remain available when reserves are scarce.
ERCOT load zones and trading hubs
ERCOT has 8 load zones and 7 trading hubs. Load zones are where retail load is settled. Hubs are pricing points used for trading and hedging.
Source: ERCOT.
The four large zones (North, Houston, South, West) cover most of the competitive retail market. The other four belong to municipal utilities and cooperatives that settle as their own zones. North Hub is the most heavily traded ERCOT price point.
Prices can differ sharply between zones because of transmission congestion. Zone-level forecasts show where congestion will split prices. See The importance of zone-level forecasting.
Who participates in the ERCOT market
ERCOT's market includes generators, retailers, utilities, traders, and large energy users. Each faces a different forecasting problem.
See how ERCOT participants use Amperon:
- How Rayburn Electric Cooperative is handling ERCOT's shifting net demand peak
- SEnergy uses Amperon's forecasting to develop supply strategies for ERCOT clients
What drives ERCOT net demand
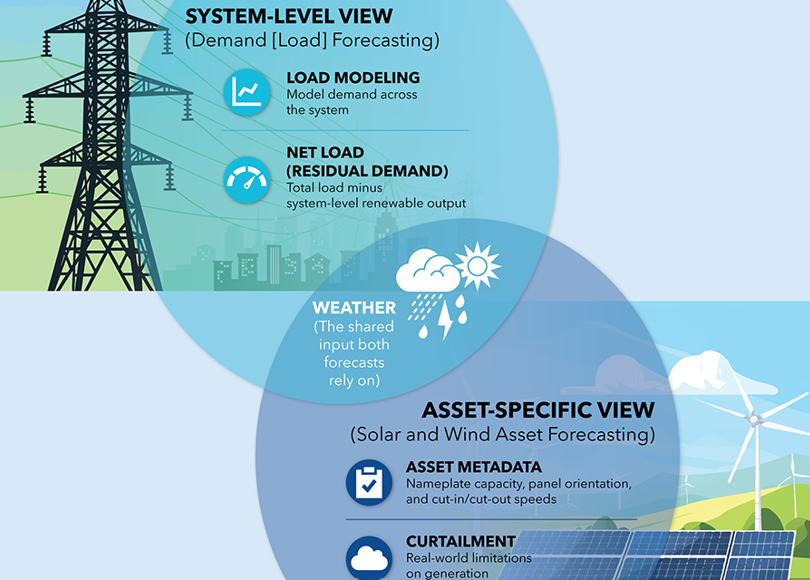
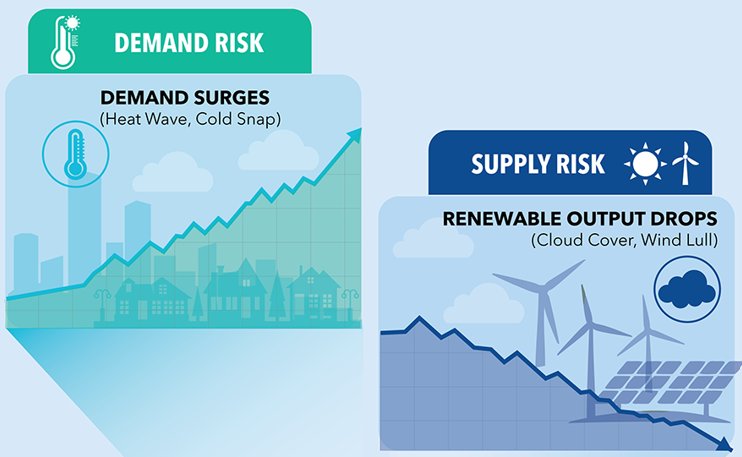
ERCOT prices are driven less by demand alone and more by net demand: total demand minus wind and solar output. When net demand rises faster than dispatchable generation can follow, prices spike. When renewables cover most of the load, prices can drop to zero or below.
ERCOT prices are driven less by demand alone and more by net demand: total demand minus wind and solar output.
Weather and heat
Temperature is the single biggest driver of ERCOT demand. Summer heat sets annual peaks, and winter cold snaps can push demand and prices to extremes, as Winter Storm Uri did in 2021. See Uri vs. Fern: how ERCOT learned to bend without breaking.
Temperature is the single biggest driver of ERCOT demand.
Solar and the shifting evening peak
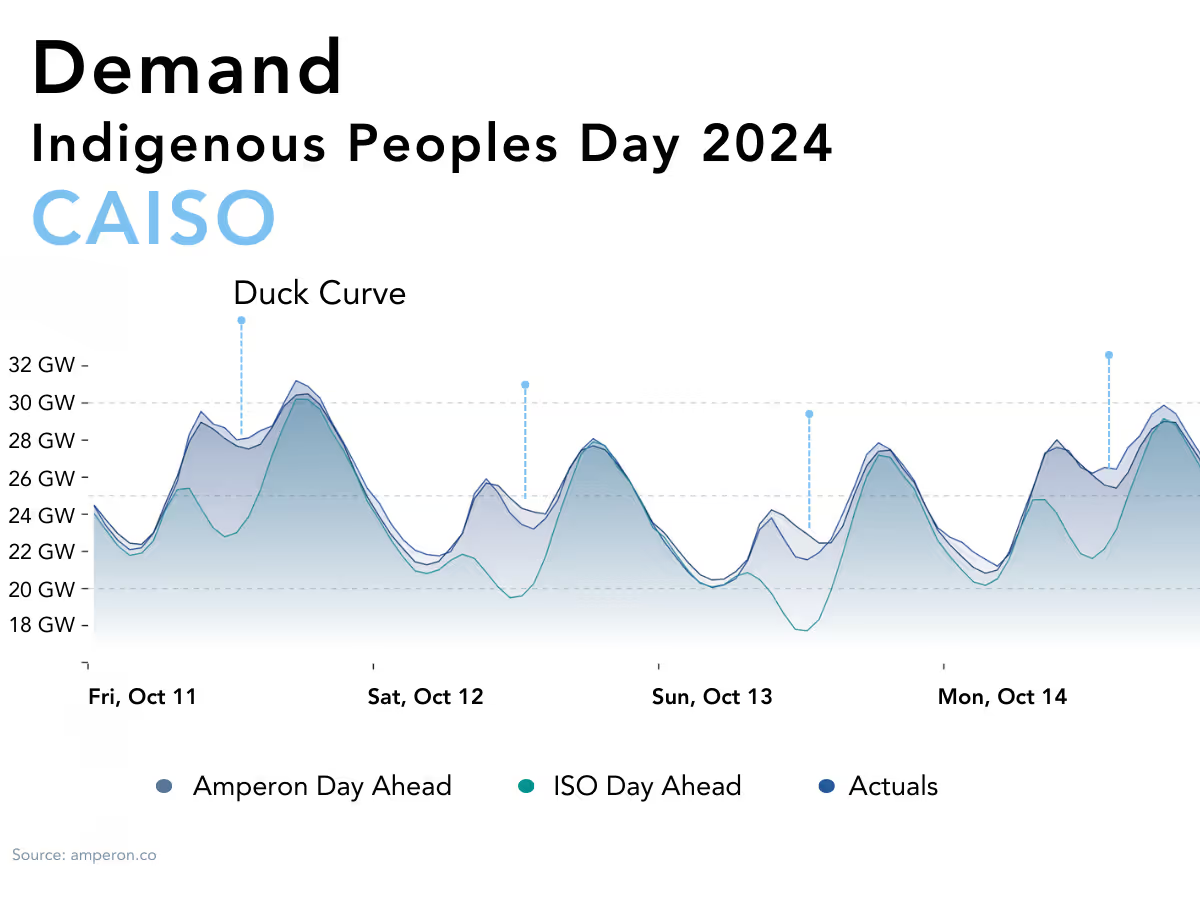
Solar growth has moved ERCOT's summer net demand peak from roughly 5:00 to 9:00pm, after the sun sets. The most frequent peak-price hours have shifted the same way, from hours ending 16–18 to hours ending 19–21. ERCOT is developing its own version of California's duck curve, though a milder one. See The rise of the duck curve in ERCOT.
Solar growth has moved ERCOT's summer net demand peak from roughly 5:00 to 9:00pm
The daily shape also changes by season. In spring, net demand has two daily peaks, one in the morning and one in the evening. Once average daily temperatures reach the mid-to-high 70s°F, usually in late April or early May, it shifts to a single evening peak. See How Texas net demand shifts from shoulder to summer.
Wind variability
Wind output swings with weather systems and drops in summer, when wind capacity factors fall 10–15%. When wind comes in below forecast, net demand rises and prices can spike. See When high demand and low wind didn't produce a price spike.
Batteries
Batteries charge midday and discharge after sunset, which can soften evening price spikes. They also create new midday "mini peaks" in demand while charging, which complicates forecasting. See When batteries break your forecast.
Outages and maintenance
Generators schedule maintenance in spring and fall. With less capacity online, shoulder-season mornings can see higher day-ahead prices than summer mornings. See Are ERCOT's morning ramp DA prices really higher than summer?
Load growth
Texas added 2.56 million residents from 2020 to 2025, which adds weather-sensitive demand. Data centers and industrial expansion add flat, around-the-clock demand on top of that, raising the baseline and leaving less room before reserves get tight. Flexible load is also shrinking as crypto mining sites convert to AI compute: Riot's Corsicana site has curtailed hundreds of megawatts during tight conditions, but AI workloads can't pause as easily. See Data center energy demand: top considerations for power traders.
Since 2021, ERCOT prices have trended lower on average while becoming more volatile. Average real-time prices fell from $149/MWh in 2021, a year inflated by Winter Storm Uri, to $30/MWh in 2024. At the same time, daily price swings on low-price days grew 14% from 2023 to 2024. See ERCOT's evolving price dynamics, 2021–2024.
Transmission costs and coincident peaks
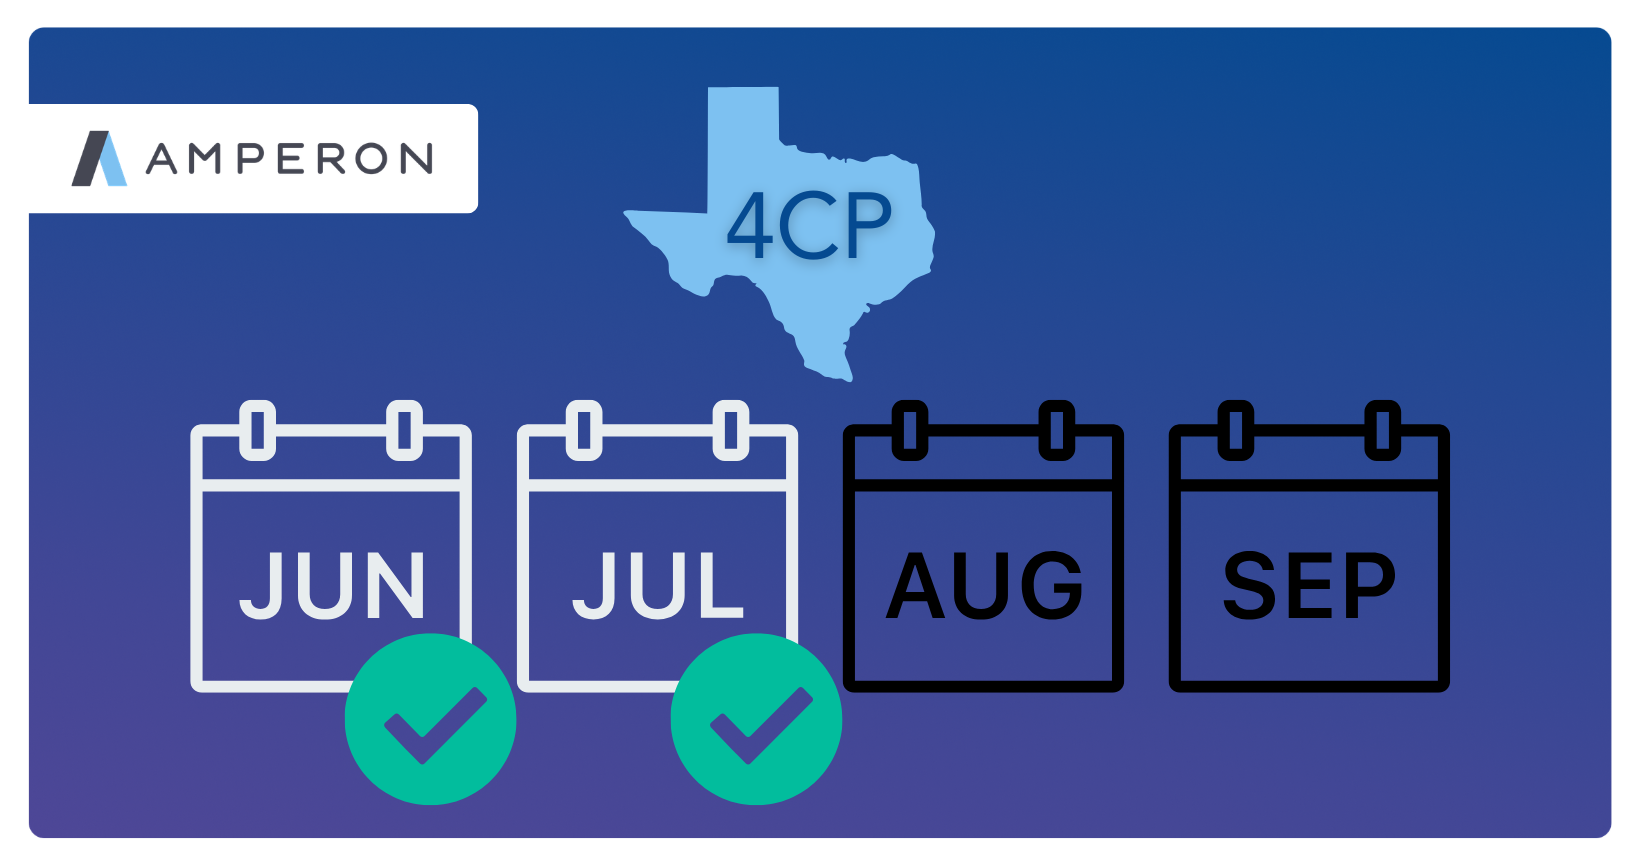
ERCOT allocates transmission costs based on demand during coincident peaks, the moments when system-wide demand is highest. Today that method is 4CP: the single highest 15-minute interval in each of June, July, August, and September. The PUCT has proposed replacing it with 12CP, which would count a peak from every month of the year.
The PUCT has proposed replacing it with 12CP, which would count a peak from every month of the year.
Final rules are due by December 31, 2026, and the first 12CP measurement month is expected in 2027 or later. For how coincident peaks are calculated and what the change means for large customers, see What is 4CP? ERCOT's coincident peak program explained and ERCOT 12CP: why Texas is moving from 4CP to monthly coincident peaks.
Amperon's Coincident Peak Alerts go out twice daily with the predicted peak interval and a 0-100 score for how likely each day is to set the monthly peak, up to seven days ahead. In 2026, Amperon flagged June 18 and July 22 as likely 4CP days more than a week in advance. See Amperon's 4CP performance, June–July 2026.
Amperon is tracking the PUCT's 12CP rulemaking and will adapt its Coincident Peak Alerts to the final rules. Explore coincident peak forecasting.
Forecasting in ERCOT
In an energy-only market with a $5,000/MWh cap, a small forecast miss can become a large financial loss. Amperon has forecast the ERCOT market since 2018 and covers every ERCOT zone and hub.
In an energy-only market with a $5,000/MWh cap, a small forecast miss can become a large financial loss.
On July 22, 2026, when ERCOT set its 91.1 GW demand record, Amperon's day-ahead demand forecast had a MAPE of 0.32%. ERCOT's own forecast had a MAPE of 2.31%, about seven times higher. See 7x better than ERCOT: How Amperon maintained accuracy in unusual conditions.
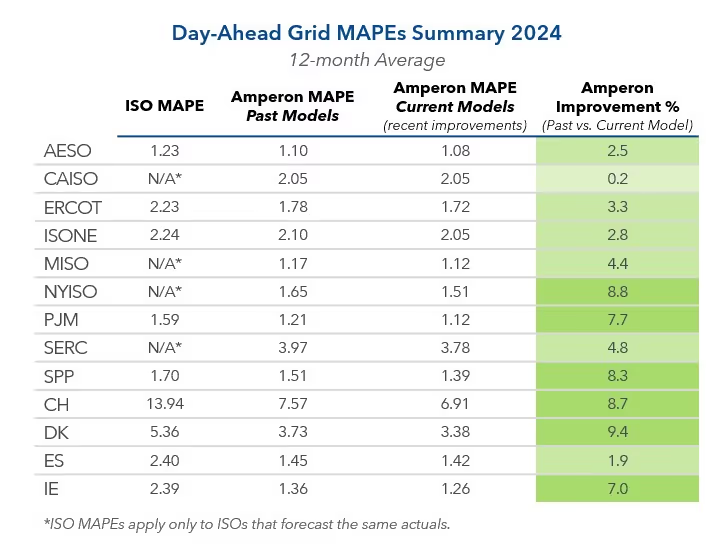
On average, Amperon’s ERCOT grid demand forecasts are roughly 30% more accurate than the grid operator’s own forecasts, using trailing 12 month data as of October 2026.
Amperon's real-time price forecast covers all ERCOT zones and hubs at five-minute intervals, 72 hours ahead. Its day-ahead price forecast runs 0-14 days out at the hub and zone level, with hourly granularity. See Real-time price predictions in ERCOT.
For seasonal planning and term trading, Amperon's mid-term forecast uses ECMWF ensemble weather models to forecast demand from two weeks to seven months ahead. See Unlocking intelligent term trading and seasonal planning.
Book a demo or request a back-test on your ERCOT portfolio.
ERCOT FAQ
What does ERCOT stand for?
ERCOT stands for the Electric Reliability Council of Texas. It is the independent system operator that manages the grid and wholesale power market for about 90% of Texas.
Is ERCOT connected to the national grid?
Only in limited ways. ERCOT has a few limited DC ties to neighboring grids and Mexico, but it is not synchronously connected to the Eastern or Western Interconnection. That keeps ERCOT outside federal (FERC) regulation of wholesale markets and limits how much power it can import in an emergency.
Does ERCOT have a capacity market?
No. ERCOT is an energy-only market, so generators earn revenue from energy and ancillary service sales rather than separate capacity payments. That design is a major reason ERCOT prices are more volatile than prices in PJM or MISO.
What are ERCOT ancillary services?
Ancillary services are reserves that keep the grid balanced and stable. ERCOT procures Fast Frequency Response, Regulation Up, Regulation Down, Responsive Reserve Service, ERCOT Contingency Reserve Service, and Non-Spinning Reserve Service.
What are ERCOT's load zones?
ERCOT has eight load zones: North, Houston, South, West, Austin Energy, CPS Energy, LCRA, and Rayburn. It also has seven trading hubs.
How much battery storage does ERCOT have?
ERCOT's latest resource adequacy outlook shows about 20.9 GW of battery storage, up from 3.2 GW at the start of 2024.
What is ERCOT's record peak demand?
ERCOT set its all-time demand record of 91.1 GW on July 22, 2026, the first time demand exceeded 90 GW.
How fast is ERCOT load growing?
ERCOT's average daily load grew 45.5% from 2014 to 2025, from 931 to 1,355 GWh/day. Annual growth rates roughly doubled, from about 2.5% in 2014-2019 to about 5.4% in 2020-2025, driven by population growth, industrial electrification, and data centers.
How does demand response work in ERCOT?
Large customers can reduce load in response to high prices and coincident peak alerts. Some large loads can also provide ancillary services directly through ERCOT programs such as Emergency Response Service. Accurate peak and price forecasts help them decide when cutting load pays off.
Where can I find an ERCOT load forecast?
ERCOT publishes its own system load forecasts. Amperon offers independent ERCOT demand, net demand, and price forecasts at the system, zone, and hub level, updated sub-hourly. See Amperon's grid forecasting and price forecasting products.
More ERCOT resources from Amperon
Market design and rules
- Why wholesale electricity prices are especially volatile in Texas
- Navigating the RTC+B paradigm shift
- What is 4CP? ERCOT's coincident peak program explained
- ERCOT 12CP: why Texas is moving from 4CP to monthly coincident peaks
Prices, net demand, and renewables
- ERCOT's evolving price dynamics, 2021–2024
- The rise of the duck curve in ERCOT
- How Texas net demand shifts from shoulder to summer
- Are ERCOT's morning ramp DA prices really higher than summer?
- Battery energy storage: ERCOT vs. CAISO
- High net demand and outages cause a price spike in ERCOT
Records, weather, and extreme events
- 7x better than ERCOT: how Amperon maintained accuracy at 91.1 GW
- Can you trade on a 3-week signal? A Winter Storm Fern analysis
- Uri vs. Fern: how ERCOT learned to bend without breaking
- Winter Storm Fern: a case study and Q&A with Amperon
- Amperon's 4CP performance, June-July 2026
Reports, webinars, and case studies
- Report: ERCOT Load Growth & Market Transformation
- Webinar: How to forecast the next record-breaking demand spike
- Case study: How Rayburn Electric Cooperative is handling ERCOT's shifting net demand peak
- Case study: SEnergy develops supply strategies for ERCOT clients with Amperon
- Case study: Review of the 2021 ERCOT long-term summer peak demand forecast

.svg)














































%20(3).png)
%20(2).png)
%20(1).png)






.png)


.avif)




.avif)
.avif)

.avif)

.avif)
%20(15).avif)
.avif)


.avif)

.avif)