Product Launch
New Product Alert! Grid Mid-Term Forecast Expands to Europe
Learn More

Ontario’s Market Renewal Program is a Major Success—Yet Volatility Remains

IESO's recent reforms have improved predictability and efficiency, yet wind and water still drive real-time price variability, even in a baseload-heavy grid.

Arianna Goldstein
March 26, 2026
March 19, 2026

Summary

1
Three major reforms have improved transparency, predictability, and efficiency in IESO, bringing it in line with other leading grids.
2
Wind and hydro variability, combined with geographic load concentration, still create volatile congestion and price patterns.
3
Amperon’s grid demand and net demand 14-day forecasts, now available for all IESO zones, help market participants anticipate load risk.
4

Ontario’s Market Renewal Program has delivered exactly what it promised: a cleaner, more transparent, and more predictable wholesale electricity market that finally aligns dispatch decisions with prices.  

Last year, Ontario’s Independent Electric System Operator (IESO) shifted to a Single Schedule Market, launched a Day-Ahead Market, and implemented Enhanced Real-Time Unit Commitment. These reforms have pulled Canada’s most populous province into line with global best practices, eliminating long-standing distortions and improving operational efficiency across a baseload-dominated grid.  

Yet even with these structural wins, volatility has not disappeared. Weather-driven wind output, seasonal hydro conditions, and a geographically concentrated load continue to inject sharp real-time price swings and congestion into the system, revealing that better market design can mitigate—but not eliminate—the fundamental physics of power.

Ontario’s Market Renewal Program Brought Three Important Reforms

In May of 2025, Ontario’s Market Renewal Program (MRP) officially went live, and we are now approaching its first anniversary. At its core, the program was designed to improve market efficiency and better align prices with the true cost of producing and consuming electricity.

The Single-Schedule Market

The centerpiece of the reform is the Single Schedule Market (SSM), which replaced the old two-schedule system. Under the legacy setup, dispatch schedules and settlement prices were calculated separately, creating a chronic misalignment between what generators were told to do and what they were actually paid for.  

The inevitable mismatches forced IESO to pay Congestion Management Settlement Credits (CMSCs)—to the tune of tens of millions annually—to compensate generators dispatched contrary to price signals.

The SSM resolves that disconnect by using a single calculation to set both dispatch instructions and prices simultaneously, so that what generators produce is what they get paid for.

The Day-Ahead Market

Prior to MRP, Ontario was notably absent from the club of ISOs that offered a formal day-ahead settlement, leaving market participants without forward price signals.  

The DAM gives participants the ability to lock in commitments and prices a day in advance, improving operational planning and reducing exposure to real-time price volatility. Final settlement flows through the Day-Ahead Real-Time Settlement (DARTS) process, which reconciles day-ahead commitments against actual real-time output.

For generators, this means more predictability in revenue. For the grid, it means fewer last-minute commitments of expensive peaking resources.  

Enhanced Real-Time Unit Commitment

Rounding out the reforms is Enhanced Real-Time Unit Commitment (ERUC), which ensures that the least-cost generation available is committed first when real-time conditions shift.  

Before ERUC, less efficient units could be called on simply because they were already online. Now the commitment logic explicitly optimizes for cost, which keeps expensive generation in reserve unless it is actually needed.

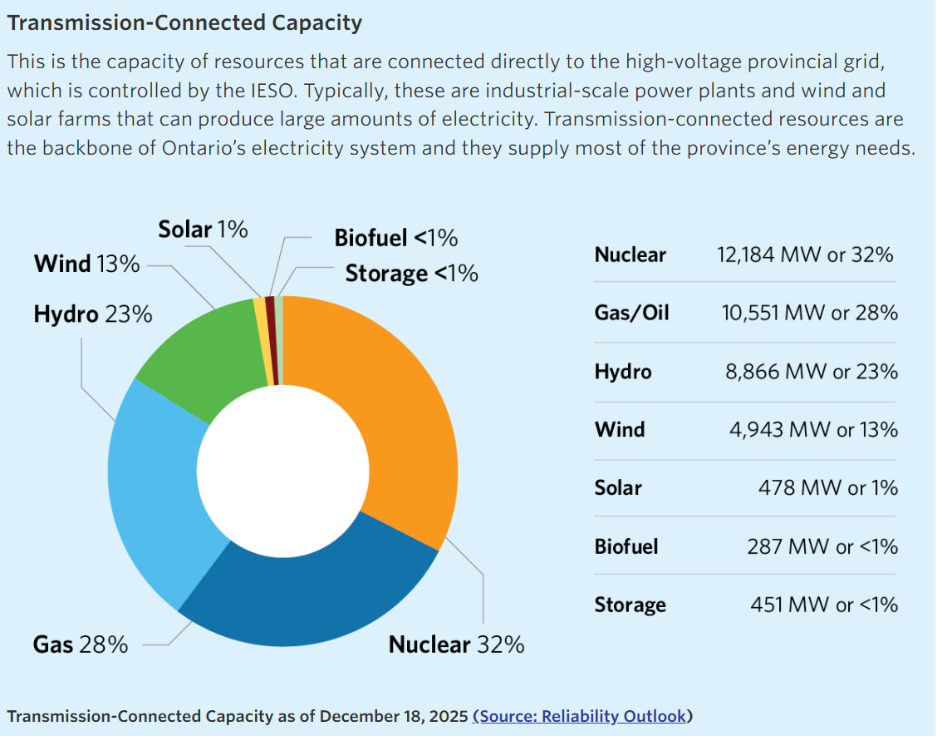
IESO’s Generation Fleet is Largely Firm and Carbon-Free

Nuclear and hydro are the twin pillars of Ontario's generation fleet, making IESO one of the most carbon-free grids in North America. Nuclear accounts for roughly 50% of total generation output and runs essentially around the clock as baseload, while hydro contributes about 25%.  

Together, they mean that on most hours of the year, Ontario's grid is operating on a nearly emissions-free stack before a single wind turbine or gas plant is dispatched.

Ontario IESO electric generation sources pie chart
Ontario’s generation stack features large amounts of firm, carbon-free nuclear and hydro resources, in addition to gas and wind. Source: IESO

That was not always the case. In the early 2000s, coal made up approximately 20% of Ontario's generation mix. Through a deliberate and aggressive retirement program, the province shut down every coal plant in the province by 2014, a feat no other major grid operator in North America had accomplished at the time. Wind and gas largely stepped in to fill the gap left behind.

Concentrated Demand is Misaligned with Clean Generation, Creating Bottlenecks

Previously, province-wide pricing masked significant differences in grid congestion between highly populated areas in Southern Ontario and the vast expanses to the north.  The new Day-Ahead Market introduced roughly 1,000 pricing nodes across Ontario’s grid, revealing significant transmission constraints.

Ontario is home to over 15 million people and contains nearly 40% of Canada's total population, with more than 40% of that concentrated in the Toronto metro region. That geographic concentration means that demand is heavily weighted to the southeast corner of the province.  

Meanwhile, the bulk of clean generation sits to the north and west, a structural tension that the new nodal pricing framework under MRP is now better positioned to surface and manage.

Wind generation is concentrated near the major demand centers in the southwest and west of the province, a geographic alignment that helps reduce transmission losses. Most of Ontario's hydro capacity, by contrast, sits in the far Northwest zone, a much less populated part of the province, which means that hydro output has to travel long distances to reach where demand actually is.

Imports, Exports, and Interconnections Create a Dynamic Market

Ontario's ties to neighboring systems are a defining feature of the market. IESO directly connects with New York, Michigan, and Minnesota on the US side. Net exports to regions like NYISO have declined in recent years as Ontario's own demand has grown, a prolonged drought the past few years has reduced hydro output, and nuclear refurbishment outages have further reduced available supply.  

Flows are still very much present, however, particularly overnight when nuclear generation continues running steadily while Ontario demand falls. That overnight surplus finds a home in neighboring markets, keeping prices low and keeping baseload utilization high. NYISO imported ~600–900 MW from Ontario most hours in 2021–2024.  

As nuclear refurbishments wrap up through the late 2020s and 2030s and new capacity comes online through IESO's Long-Term RFP procurements, the export picture could shift again.

Wind Volatility and Seasonal Weather Sensitivity Remain

Hydro and wind behave very differently on the grid, and understanding those nuances matters for reading real-time prices in Ontario. Hydro is relatively predictable day-over-day, but it can vary significantly by season depending on precipitation and snowmelt. Wind output ramps up and down on very short time scales, which can push real-time prices well below day-ahead levels.

Precipitation deserves special attention in any IESO analysis. Because hydro makes up roughly a quarter of generation, a dry year directly reduces available clean energy, putting upward pressure on gas dispatch, natural gas prices, and the broader supply and demand balance.  

In a wet year with strong snowmelt and reservoir levels, hydro output expands, exports tend to increase, and prices can soften considerably. This seasonal hydrological cycle is one of the more underappreciated drivers of year-over-year price variation in Ontario.

Wind is a different animal entirely. Large low-pressure systems sweeping across the province can produce strong generation in one zone while leaving another nearly calm, creating zonal imbalances and congestion.  

When it underperforms expectations, the reverse happens. This is one of the clearest mechanisms through which RT prices diverge from DAM in IESO, and it is a dynamic that will only become more pronounced as the nodal pricing under MRP makes zonal price differences visible for the first time.

Ontario's Climate Adds Another Layer of Grid Complexity

Some may be surprised to learn that IESO is a summer peaking ISO. The hottest and most humid days of July and August drive peak demand, as air conditioning load across the densely populated Greater Toronto Area pushes the system to its limits.  

Of course, Canada gets cold, too. Cold, windy winters and hot, humid summers both stress the grid from opposite ends of the demand curve. Moreover, shoulder seasons can be deceptively volatile, with large fronts moving through quickly and severe weather possible across multiple zones simultaneously.  

Solar generation remains a relatively small contributor compared to other markets partly for this reason. Ontario's cloud cover, limited roof-space economics relative to sunnier US states, and the existing depth of nuclear and hydro capacity have slowed distributed solar penetration. Wind is the primary renewable source beyond hydro, and its footprint continues to grow especially in the southwest.

As a result, real-time price volatility is still quite high in IESO, despite high levels of baseload generation and stable day-ahead prices, and generally high DA/RT alignment. Weather-related load and generation forecast misses, along with isolated demand spikes and generator outages, can lead to extreme real-time swings in net load and prices.

Amperon's IESO Coverage

Amperon recently launched its IESO 14-day demand and net demand forecast, available down to the zonal level.

If you are tracking Ontario load and want a longer planning horizon than IESO's own published outlook, explore Amperon's Power Markets Trading solutions.

AI-driven Forecasting

Our advanced machine learning methodology delivers the accuracy you need to optimize operations and maximize profits.

  • 40K weather points from 4 vendors
  • 15-day short-term forecasts that update sub-hourly
  • Globally available
  • Leading UI/UX or API delivery
Book a demo

Want 3x more accurate forecasts? Let's talk.

Book a demo

Related articles

Left arrow icon for navigationRight arrow icon for navigation
Blog
March 26, 2026
The War in Iran and What It Means for Energy Forecasting
Open article
Blog
March 26, 2026
Ontario’s Market Renewal Program is a Major Success—Yet Volatility Remains
Open article
Blog
March 23, 2026
Seasonal Change Brings Forecasting Problems—Unless Your Model is Built for It
Open article
Blog
March 3, 2026
A Tale of Three Markets: The Winds of Change Blow Differently Across Europe
Open article
Blog
March 26, 2026
Quantifying Solar Uncertainty with Probabilistic Forecasting
Open article
Blog
March 3, 2026
The Future of Term Trading: Quantifying Tail Risk
Open article
Blog
March 3, 2026
Mitigating Curtailment Risk With Smarter Wind and Solar Forecasting
Open article
Blog
March 3, 2026
cnMAE: The Right Metric for Evaluating Solar & Wind Forecasts
Open article
Blog
February 16, 2026
How to Use Wind and Solar Forecasts: Net Load Forecasting and Day-Ahead Optimization
Open article
Blog
February 11, 2026
Uri vs. Fern: How ERCOT Learned to Bend Without Breaking
Open article
Blog
February 3, 2026
Before the Cold Hit: Early Demand Signals Behind January’s Arctic-Driven Power Price Surge
Open article
Blog
February 12, 2026
The Evolution of Energy Forecasting: From Deterministic to Probabilistic
Open article
Blog
February 3, 2026
Hedging Tail Risk: Term Traders Get a Powerful New Risk Management Tool
Open article
Blog
January 26, 2026
Sub-Hourly STF Improves Day-Ahead Positioning in the Era of Renewables
Open article
Blog
January 26, 2026
Behind PJM’s 800% Increase in Capacity Prices and Trump’s Emergency Auction Plan
Open article
Blog
January 8, 2026
Germany Proves Transmission is Just as Critical as Generation
Open article
Blog
January 8, 2026
How Amperon Won the Holidays
Open article
Blog
January 23, 2026
6 Grid Trends to Watch in 2026
Open article
Blog
December 12, 2025
Battery Energy Storage: ERCOT vs. CAISO
Open article
Blog
December 19, 2025
European Power Traders Finally Get One-Stop Forecasting
Open article
Blog
December 6, 2025
The Pacific Northwest Risks a 6 GW Shortfall This Winter
Open article
Blog
December 17, 2025
With Millions On the Line, Amperon Called Cold Snap 33 Days Out
Open article
Blog
December 5, 2025
Chilean Solar and Wind Asset Owners Face Hourly Reporting Under New Market Structure
Open article
Blog
December 5, 2025
Can PJM Keep Up with Exponential Load Growth?
Open article
Blog
December 5, 2025
US Winter Weather Outlook 2025–2026: Mild on Paper, Volatile in Practice
Open article
Blog
March 17, 2026
Ontario’s Day-Ahead Market is a Renewables Profitability Test
Open article
Blog
March 3, 2026
US Solar and Wind Curtailment Is Exploding
Open article
Blog
March 12, 2026
Navigating the RTC+B Paradigm Shift
Open article
Case study banner reading “Nailing MISO’s Fall 2025 Coincident Peak” with a computer displaying grid demand forecasts
Blog
December 5, 2025
Nailing MISO's Fall 2025 Coincident Peak: A Week-Ahead Perfect Call
Open article
Amperon MTF model visualization displaying market trends and forecasts
Blog
December 5, 2025
Unlocking Intelligent Term Trading and Seasonal Planning  
Open article
Blog post header with palm tree in hurricane winds asking Why Has This Hurricane Season Been So Quiet with Amperon branding
Blog
December 5, 2025
Why Has This Hurricane Season Been So Quiet?
Open article
Table showing parallel flow congestion scenarios across different energy markets including ISO/RTO, WEIM, WEIS, Markets+, and EDAM with scheduled delivery systems and mitigation strategies
Blog
March 12, 2026
CAISO Breaks the Transmission Hedge
Open article
Amperon blog post graphic asking High ERCOT Demand, Low Wind, and No Price Spike? with load forecast chart for August 18, 2025
Blog
December 5, 2025
High ERCOT Demand, Low Wind, and No Price Spike?
Open article
ISONE May hourly average load comparison chart showing data from 2023, 2024, and 2025 with peak loads around 13,534 MW at HE17-18
Blog
December 5, 2025
Electrification and BTM Solar: Reshaping Demand in ISO New England
Open article
Line graph showing MISO Net Load from 2022-2025 comparing hourly load patterns ranging from 50,000 to 90,000 MW across 24-hour period
Blog
December 9, 2025
The Rise of the Duck Curve in ERCOT: A Shift in Net Demand Peak and the Future of Solar Power Integration
Open article
Amperon market analysis titled Where's the Chaos? ERCOT's Surprisingly Quiet Summer with curved line graph showing peak demand trends from 2022-2025
Blog
December 5, 2025
Where’s the Chaos? ERCOT’s Surprisingly Quiet Summer
Open article
Amperon forecasted load versus prediction time by weather vendor chart for PJM on June 24, 2025, showing settled demand at 158.2 GW with multiple vendor forecasts (ENS_1, NBM, DTN, AG2)
Blog
December 8, 2025
PJM Breaks 10-Year Peak Load Record — and Amperon Saw It Coming 7 Days Out
Open article
Blog
December 8, 2025
PJM Forecast: June 23–25 Heat Wave May Shatter Summer Expectations
Open article
Blog
December 8, 2025
ISONE’s First Heat Spike of Summer- and Amperon Nailed It
Open article
Amperon whitepaper cover titled Cost of Uncertainty: The Challenges and Value of Accurate Price Forecasting with download button, dated March 2025
Blog
December 10, 2025
Why Wholesale Electricity Prices are ESPECIALLY Volatile in Texas
Open article
Blog
December 10, 2025
Powering Profitable Growth for Retail Electricity Providers: Turn Load Forecasting into Your Competitive Edge
Open article
Blog
December 10, 2025
Navigating ERCOT’s 4CP Program: Key Updates and Strategic Preparation for 2025
Open article
Amperon promotional banner announcing sub-hourly grid forecasts for European TSOs now available, featuring transmission tower with geometric orange and blue design elements
Blog
December 10, 2025
Europe’s Shift to 15-Minute Power Markets: How Amperon Helps You Prepare for Market Evolution
Open article
Amperon blog post graphic titled "The Shape Shift: How Texas Net Demand Transitions from Shoulder to Summer" with wind turbine image
Blog
December 10, 2025
The Shape Shift: How Texas Net Demand Transitions from Shoulder to Summer
Open article
Amperon presentation slide titled "ERCOT's Evolving Price Dynamics 2021-2024 Analysis" with sunset transmission tower image
Blog
December 11, 2025
ERCOT’s Evolving Price Dynamics [2021-2024 Analysis]
Open article
A promotional image announcing the introduction of real-time grid price forecasts now live in ERCOT, featuring Amperon branding
Blog
December 10, 2025
Amperon Expands Forecasting Capabilities with Real-Time Price Predictions in ERCOT
Open article
Blog
December 10, 2025
MISO’s VOLL Change Could Reshape Scarcity Pricing and Reliability Signals
Open article
Blog
December 10, 2025
Why Behind-the-meter Solar Complicates Spring Forecasting
Open article
Comparison table showing solar and wind forecasting capabilities across Machine Learning, Physics-based, and Amperon (ML+PB) approaches for partial asset metadata, soiling, equipment degradation, biased weather, and curtailment
Blog
December 10, 2025
How to Forecast Energy Generation for Wind or Solar Assets
Open article
Day-ahead grid MAPE summary table for 2024 showing 12-month average comparison of ISO MAPE, Amperon MAPE past models, current models, and improvement percentages across multiple ISOs (AESO, CAISO, ERCOT, ISONE, MISO, NYISO, PJM, SERC, SPP, CH, DK, ES, IE)
Blog
December 10, 2025
Always Innovating: Amperon’s New Techniques to Improve Energy Forecasting
Open article
Amperon recap slide for April 7 titled "Why prices in ERCOT soared to $4000 per MW" with pastoral field landscape at golden hour
Blog
December 10, 2025
High Net Demand and Outages Caused Recent Price Spike in ERCOT
Open article
Amperon ebook promotional banner "Price Forecasting: Cost of Uncertainty - The Challenges and Value of Accurate Price Forecasting" with free ebook download button on gradient blue-green background
Blog
December 10, 2025
Are ERCOT’s morning ramp DA prices really higher than summer?
Open article
Infographic titled "Types of Data Relevant to Both Solar and Wind Assets" showing three categories: Nameplate Capacity, Location of Asset, and Historic Curtailment with wind turbines and solar panels imagery
Blog
December 10, 2025
Inside our Data: Intro to Renewable Asset Data
Open article
Amperon promotional slide "Adapting to OMIE's 15-Minute Transition: How Granular Forecasts Can Help You Stay Ahead" with laptop showing asset-level solar sub-hourly forecast for January 12, 2025
Blog
December 10, 2025
Adapting to OMIE’s (Portugal and Spain) 15-Minute Transition: How Granular Forecasts Can Help You Stay Ahead
Open article
Blog
December 11, 2025
What the beginning of daylight savings time means for peak pricing
Open article
Amperon presentation slide "How the Grid Changed in 2024" with aerial view of large-scale solar farm installation in agricultural setting at sunset
Blog
December 11, 2025
How the Grid Changed in 2024
Open article
Amperon recap slide for February 14-20 titled "Another cold week on the grid, another good week for Amperon's demand forecasts" with wind turbines in snowy landscape
Blog
December 11, 2025
Another cold week on the grid, another good week for Amperon’s demand forecasts
Open article
Blog
December 11, 2025
The Future of Western Power Markets: Why Implementing a Day-Ahead Market Matters
Open article
Blog
December 11, 2025
Harnessing the power of sub-hourly and hourly forecasts for wind assets
Open article
Blog
December 11, 2025
Forecasting for the Super Bowl: How much does the big game really affect demand?
Open article
Amperon promotional banner stating "33% more accurate in MISO" with blue gradient background and solar panels with wind turbines imagery
Blog
December 11, 2025
Best Demand and Net Demand Forecasting Calls to End 2024
Open article
Amperon slide featuring Punxsutawney Phil prediction reference titled "What Punxsutawney Phil's prediction for 6 more weeks of winter really means for the grid" with snowy groundhog image
Blog
December 11, 2025
What Punxsutawney Phil’s prediction for 6 more weeks of winter really means for the grid
Open article
Blog promotional graphic on navy background titled "New Blog: Why a hybrid regression/ML approach outperforms in energy forecasting" with layered visualization showing Linear Regression, Boosted Trees, and Additional secondary models
Blog
November 18, 2025
Why a hybrid regression/ML approach outperforms in energy forecasting
Open article
Blog
June 3, 2025
Europe 2024 Best Amperon Forecasting Calls and Trends to Watch
Open article
Title slide reading "Part 1: Inside Our Data: The Importance of Granular Weather Data" by Lily Bowdler from Amperon
Blog
November 18, 2025
Inside our Data: The Importance of Granular Weather Data
Open article
Bar chart showing 2025 Highest ISO Demand Levels So Far across four ISOs: ERCOT (68.9 GW), PJM (126.8 GW), MISO (97.9 GW), and SPP (43.1 GW)
Blog
November 18, 2025
Déjà vu? With one cold snap down, will we have a repeat of last MLK weekend?
Open article
Blog promotional slide "The first winter cold snap is here, but will it break records?" with laptop displaying PJM weather data showing 5-year, 10-year, and 30-year normals for various cities
Blog
November 18, 2025
First winter cold snap is here, but will it break records?
Open article
Blog
June 3, 2025
Looking Back (and Ahead): A Year-end Q&A with Amperon CEO Sean Kelly
Open article
Line graph comparing Ireland Wind Generation forecasts for August 20-26, showing Actual Wind, Amperon Day Ahead Wind Forecast, and EirGrid Day Ahead Wind Forecast (duplicate of image 43)
Blog
November 18, 2025
How strong winds in Ireland left power market stakeholders exposed
Open article
Line graph of CAISO demand for Indigenous Peoples Day 2024 (October 11-14), showing Duck Curve pattern and comparing Amperon Day Ahead, ISO Day Ahead, and Actuals
Blog
November 18, 2025
Forecasting for the holidays: How holidays affect demand patterns
Open article
Blog
June 3, 2025
When tech buys nuclear, who wins?
Open article
Blog
November 18, 2025
Unlocking new standards in solar forecasting to maximize asset efficiency
Open article
Marketing graphic titled "What's Happening with Price Forecasting? A Q&A with Amperon CEO Sean Kelly" featuring professional headshot of Sean Kelly
Blog
November 18, 2025
What’s Happening with Price Forecasting? A Q&A with Amperon CEO Sean Kelly
Open article
Blog
November 18, 2025
Taking Advantage of Amperon’s Net Demand Forecast on Snowflake
Open article
Line graph showing ES (Spain) Demand for August 15 Feast of Assumption, with table comparing Peak Demand, Amperon APE, and ES APE percentages across four dates, plus lower panel showing electricity production and spot prices
Blog
November 18, 2025
2024 Energy Demand Trends: What Happened During 3 Recent EU Holidays
Open article
Blog
June 3, 2025
PJM Capacity Auction: Record Pricing and Delays
Open article
Multi-panel visualization showing ERCOT Demand for July 1-5, including line graphs comparing Amperon and ERCOT forecasts, data tables showing MAPE percentages for different dates, and gauge charts showing average MAPE (1.02% AMP, 1.69% ISO)
Blog
November 18, 2025
Amperon’s best energy forecasting calls for Summer 2024
Open article
Marketing text overlay on transmission tower background stating "Amperon's new price forecast tackles ERCOT's volatility and helps market participants mitigate risks"
Blog
November 18, 2025
Amperon’s new price forecast tackles ERCOT’s volatility and helps market participants mitigate risks
Open article
Marketing graphic announcing "Expanding Amperon's coverage on Snowflake" for Demand and Net Demand across North America and Europe ISO/TSOs, featuring screenshot of Snowflake marketplace interface
Blog
November 18, 2025
Expanding Amperon’s coverage on Snowflake: Demand and Net Demand for North America and Europe ISO/TSOs
Open article
Video thumbnail from webinar titled "Powering Data-Driven Decisions: Enhance Your Energy Trading Game with Amperon + Snowflake" featuring Amperon and Snowflake logos, dated September 26, 2024, with transmission tower image and video progress indicator show
Blog
November 18, 2025
Powering Data-Driven Decisions: Enhance your energy trading game with Amperon & Snowflake
Open article
Photograph of single wind turbine on hilltop with autumn-colored foliage in foreground against clear blue sky
Blog
November 18, 2025
Analysis of spring curtailments in preparation for fall
Open article
Marketing graphic announcing "Introducing Asset-Level Wind Short-Term Forecasts" with photograph of wind turbines against mountain landscape backdrop
Blog
November 18, 2025
Expanding generation forecast capabilities into wind
Open article
ERCOT West Zone Net Demand Short-Term Forecast for August 11-13, 2024, showing three stacked area graphs for Net Demand, Solar Generation, and Wind Generation, with explanatory text about negative net load, curtailments, and congestion implications
Blog
November 18, 2025
Granular insights from grid net demand forecasts: Importance of zone-level forecasting
Open article
Blog
December 2, 2025
Why solar forecasts and accuracy metrics are a big deal
Open article
Satellite view from space showing large hurricane system with visible eye wall approaching Caribbean islands, showing Earth's curvature against black space background
Blog
November 18, 2025
Weaker hurricane season due to Saharan dust
Open article
Close-up photograph of solar panel array showing dust, dirt, and debris accumulation on photovoltaic panel surfaces, demonstrating need for maintenance
Blog
November 18, 2025
Hailstorms: How they can impact your solar farm
Open article
Nighttime satellite image showing hurricane system with well-defined spiral structure making landfall on southeastern United States coastline with visible city lights
Blog
November 18, 2025
Forecasting for SERC During Tropical Storm Debby
Open article
Photograph of dark chalkboard filled with mathematical equations, formulas, and diagrams including algebraic expressions, chemical structures, geometric drawings, and calculus notations written in white chalk
Blog
November 18, 2025
The different kinds of forecasting metrics
Open article
Blog
November 18, 2025
Amperon’s industry-leading forecasts now available to transact on the Microsoft Azure Marketplace
Open article
Aerial photograph of wind farm installation with three large white wind turbines on rolling green hills with mountains in background and scattered buildings in rural landscape
Blog
November 18, 2025
Reminiscing on the summer’s heat waves... so far
Open article
Marketing graphic announcing "Introducing Solar Sub-Hourly Generation Forecasts" with photograph of solar panel installation on ground-mounted framework in grassy field
Blog
November 18, 2025
Harnessing sub-hourly solar forecasts for power markets trading
Open article
Blog
November 18, 2025
Amperon’s methodologies: AI-powered forecasting for the energy transition
Open article
Blog
June 3, 2025
The Double-Edged Sword: Using LLMs in Electricity Market Forecasting
Open article
Satellite image of two tropical cyclone systems near Asian coastline showing clear hurricane eyes and spiral cloud formations over ocean waters with land mass visible on left side
Blog
November 18, 2025
Advanced stress testing for extreme weather
Open article
Blog
June 3, 2025
Enabling Amperon’s short-term grid forecast with Snowflake
Open article
Upward angle photograph of tall electrical transmission tower structure against blue sky with white clouds, showing multiple levels of power line connections and lattice framework construction
Blog
November 18, 2025
Amperon’s best forecasting calls this Spring
Open article
PJM heat wave peak demand forecast comparison table showing Amperon APE vs PJM APE for June 18-23
Blog
November 18, 2025
PJM Heatwave Analysis: Forecasting for 90-degree heat and a new federal holiday
Open article
Seattle city skyline at night featuring the Space Needle with illuminated buildings
Blog
November 18, 2025
A deep dive into what happened MLK weekend in the Pacific Northwest and West Coast
Open article
30-year temperature normals table showing forecasts for cities from Newark to Rockford, June 12-26
Blog
November 18, 2025
June 2024 heat wave - PJM
Open article
Houston demand chart showing May 16 power outage affecting 1 million people with Amperon's weather actuals vs actual load
Blog
November 18, 2025
Storm Analysis: ERCOT’s intense may weather
Open article