

Over the past few years, ERCOT’s power market has undergone a dramatic shift. From the high averages of 2021 and 2022 to the more subdued averages of 2023 and 2024, electricity prices have steadily declined. This of course, excluding the prices for the hottest summer in history (2023). At first glance, this seems like good news for consumers and businesses alike. However, while overall prices have dropped, market volatility has only intensified.
The primary driver of this growing volatility? The rapid expansion of renewable energy. Wind and solar generation now make up a larger share of ERCOT’s supply mix than ever before, introducing new challenges in balancing supply and demand. Unlike traditional thermal generation, which provides consistent output, renewables are highly dependent on weather conditions, leading to larger daily swings in demand that needs to be covered by thermal generation or net demand. We will explore how ERCOT’s price dynamics have evolved from 2021 to 2024, the role renewables play in shaping volatility, and what these trends mean for market participants moving forward.
Natural Gas’ Impact on Electricity Prices
Between 2021 and 2024, ERCOT's electricity prices have experienced notable changes in both cost and volatility, especially in relation to natural gas price trends. As one of the most important fuel sources for electricity generation in Texas, natural gas prices have a direct impact on the market’s locational marginal prices (LMPs). Natural gas long-term prices peaked in the summer of 2022, after rising steadily from 2021, and have since stabilized at lower levels in 2023 and 2024. Despite these lower prices, the volatility within ERCOT has increased significantly, reflecting a complex dynamic, influenced by the growing share of renewable energy sources on the grid. 1
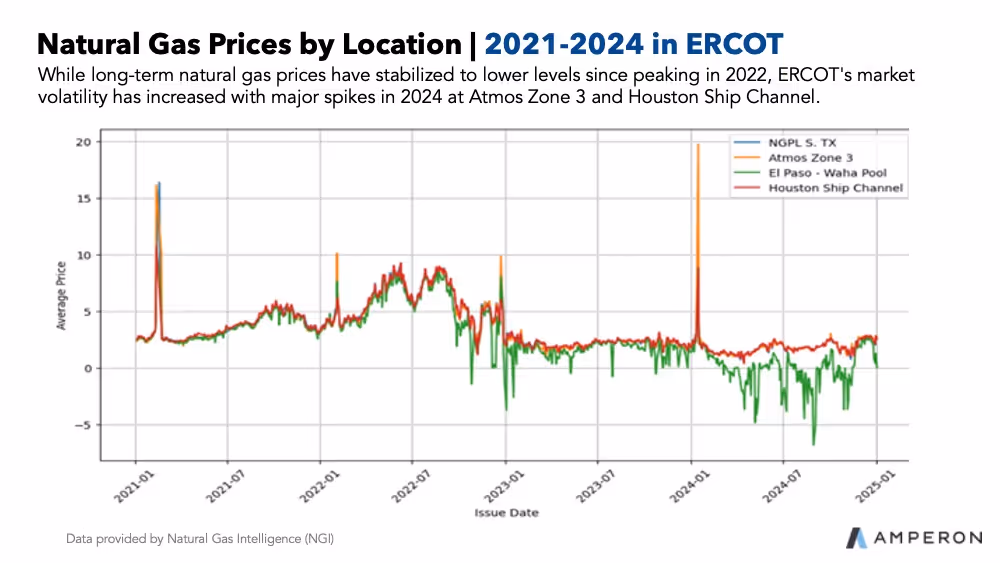
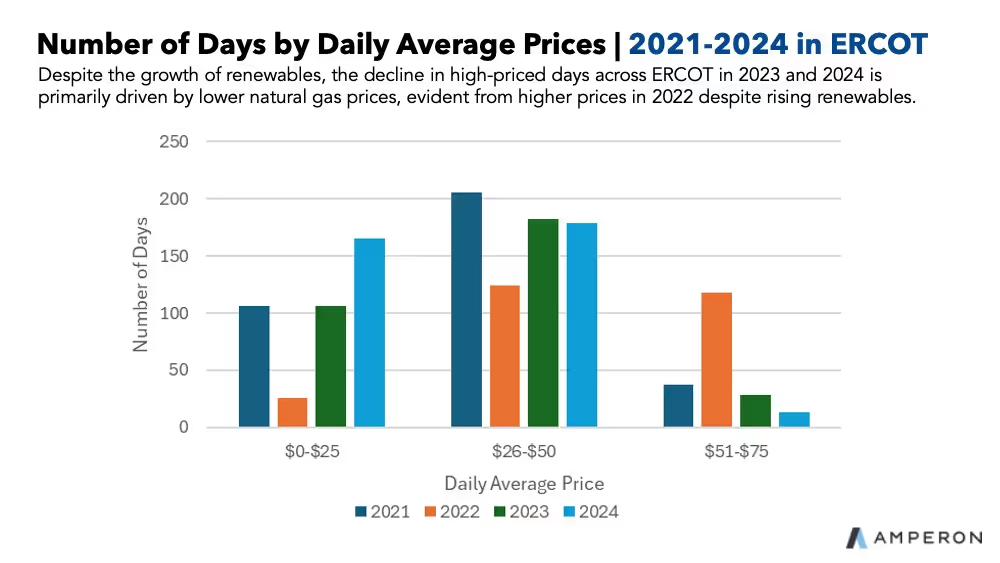
The price of natural gas, which remains the marginal price setter in many hours, will always have a strong influence on ERCOT’s LMPs. This trend is consistent across all load zones in ERCOT. When looking at the daily average price of LMPs across all zones, we see a decline in the number of higher-priced days in 2023 and 2024 compared to the previous years.
This shift is heavily influenced by natural gas prices since it is usually the marginal price setter. The argument can be made that some of this shift is partly due to the massive number of renewables coming online, but 2022 had more higher price days than 2021. So, renewable energy may have an impact on lowering the average price, but natural gas is still helping to keep prices low in recent years.
Renewables Driving Volatility
The major effect that renewables have on price is volatility. This is mainly because it changes the way that dispatchable generators need to operate. Looking at volatility from a daily standard deviation price, each of the three ranges of average prices that fall under $75/MWh are higher in 2024 than any other year. This is generally the case with 2023 as well for years before.

Looking at the chart above, average daily prices that fall below $25/MWh daily deviation increased 14% and 7% for prices that were between $26- $50/MWh from 2023 to 2024. This trend has been constant over the last four years with daily volatility increasing. One of the most concerning things, is the daily volatility of price for prices above $50/MWh is equal to or higher than the average price of the day. This goes to show how much prices swing within a single day.
This increase in standard deviation is coming from the increase in renewable capacity across the grid. Over the course of the year, the deviation is getting larger from low prices in the middle of the day from solar and higher prices in the afternoon because solar is ramping down. This trend will only continue as more solar is added onto the grid because it makes it more difficult to handle the evening increase in net demand when solar is ending. This increase is causing the duck curve to stand out more and more like in CAISO during the springtime.
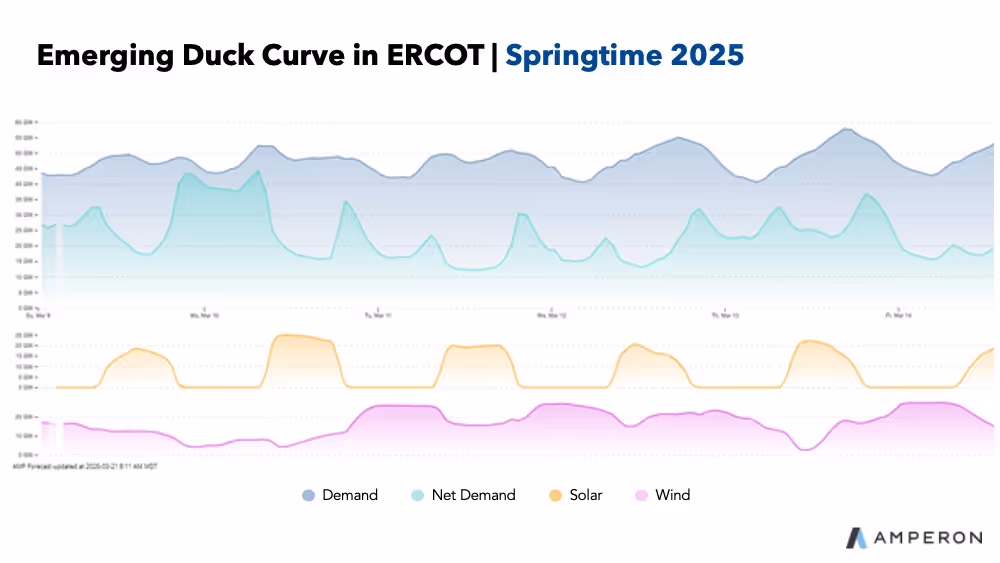
Shown above, ERCOT’s duck curve reflects the grid’s ability to manage demand in the morning before solar ramps and in the evenings when solar is ramping down. On the other hand, during the summer, ERCOT’s net demand curve shifts to a single evening peak. This is due to the windy season ending, leading to reduced wind generation during the middle of the day and lower efficiency in the evening. On average, wind capacity factor drops between 10%-15% in the summer compared to other seasons.
The Generation Ramp Up
Whether it’s the duck curve in the winter and the shoulder season or extreme evening peaks during the summer, ERCOT is expected to ramp generation anywhere from 10GW-25GW within a few hours daily. Even when generation is expected to ramp this much within a short time frame, they are not expected to stay online for more than 4-6 hours as renewables soon kick back in or demand starts its decline for the day.
This massive variability that occurs daily has generators flipping on and off like a light switch, leading to higher costs due to less consistency and run time. This is due to peaker plants capacity factors3 increasing while intermediate load generators remain steady or decline. With faster ramp times, peaker plants are taking advantage of generators that have slower ramp times. Though there is a big question on whether or not this causes more wear and tear on generators from ramping up and down so much.
Looking at historical averages of prices at all load zones, it is clear the average prices are lowering year over year. So why is this a problem? Because the daily volatility and deviation of price is increasing. While averages are lowering, this hides the fact that ERCOT is struggling with a volatility issue. If you have a large load during the peak price of the day, it can be a tough pill to swallow.
Importance of Batteries
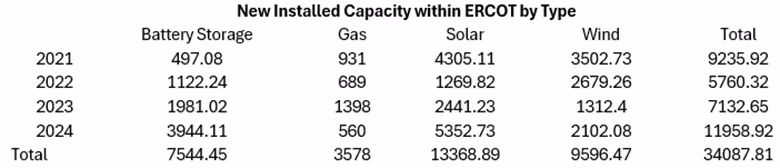
This highlights the energy transition paradox: As more renewables are added to the gird, new challenges emerge that ERCOT will need to address. So, how are market participants and ERCOT responding to these large daily price disparities? They are building a number of battery storage facilities to support more renewables which helps to prolong the underlaying issue of a surging net demand within a few hours.
Batteries aren’t the perfect solution yet, which is why it prolongs the issue compared to solving it. The total capacity of battery storage is nowhere near solar capacity, so thermal generation is still heavily needed during these times of the day. Secondly, batteries being built don’t have a long duration. Most within ERCOT only last for one to two hours. They are currently handling the large ramp and relieving power plants that have long ramp times, but they cannot last several hours after the initial ramp that is needed.
Future of ERCOT
ERCOT seems to always be in harms way every time mother nature is willing to go a few rounds. When renewables aren’t generating, it is likely ERCOT will experience outages. The main question is how much? Over the last four years, about 10% of the installed capacity has been dispatchable generation that can run more than two hours. This suggest ERCOT is content with the low averages across the year that renewables bring and not concerned about reliability.
In conclusion, market participants need to be very cautious of net demand and when peak prices occur. The days of relying on stable pricing are long gone—volatility is increasing year over year, making it critical to hedge strategically around peak demand rather than when renewables are generating. In this rapidly shifting market, real-time insights into your positions aren’t just helpful—they’re essential for staying competitive and mitigating risk.


.svg)


%20(3).png)
%20(2).png)
%20(1).png)


.png)


.avif)


.avif)

.avif)


.avif)


.avif)
%20(15).avif)

.avif)
%20(10).avif)

.avif)


.avif)

.avif)


.avif)


