Product Launch
New Product Alert! Grid Demand Mid-Term Forecasting
Learn More

Before the Cold Hit: Early Demand Signals Behind January’s Arctic-Driven Power Price Surge

Weeks before January’s Arctic blast drove high power prices across the U.S., early probabilistic mid-term demand forecasts showed the risk weeks in advance.

Arianna Goldstein
February 2, 2026
February 2, 2026

Summary

1
A major winter storm with freezing, prolonged temperatures caught many market participants off guard, forcing them to scramble to manage rising demand expectations.
2
Amperon’s Mid-Term Demand Forecast, now with probabilistic and ensemble modeling, flagged the risk weeks in advance.
3
Prices in PJM were 10x higher, or an extra $740/MWh, than when our MTF forecasts started showing signs of the cold weather.
4

A widespread Arctic storm brought subfreezing temperatures, snow, and ice across most of the U.S., pushing power systems into sustained winter stress. While the most severe impacts have passed, freezing conditions continue to linger across much of the East Coast, keeping heaters running and demand elevated even after the initial peak days.  

For many market participants, the scale and duration of the cold caught them off guard. As short-term weather models rapidly adjusted, traders were forced to scramble to reprice risk, secure supply, and manage rising demand expectations. Power prices responded quickly, moving sharply higher across PJM, ISONE, NYISO, and ERCOT as the market absorbed the new reality.

But this wasn’t a surprise for those using seasonal forecasts based on real-weather data. Amperon’s Mid-Term Demand Forecast (MTF), now with probabilistic and ensemble modeling, began flagging the risk of extreme cold and elevated peak demand weeks before prices moved, providing traders with early visibility into a setup that would ultimately drive future prices 10x higher.

This is the difference between reacting to volatility—and positioning ahead of it.

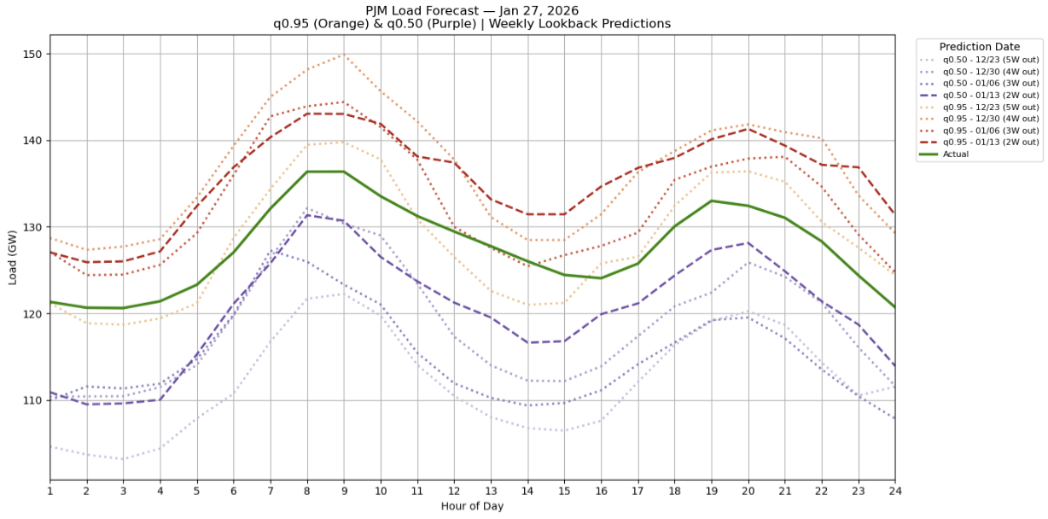
PJM: When Demand Risk Was Visible, Prices Were Still Quiet

PJM saw the highest demand days on January 29 and 30 at 139.0 and 139.1 GW. This was after January 26 and 27 also brought demand above 136 GW. While day-ahead demand fluctuated the days before, there was signal of the severe cold long before the market reflected it. Here’s a timeline of the signal our MTF picked up.

MTF Signal Timeline

  • December 17: One of MTF’s models flagged 139 GW peak demand for January 29.
  • December 19–21: The P75 and P80 predicted demand to peak around 139 GW on January 29 and 30 with more ensemble members converging into tighter agreement.  
  • Christmas week: More ensemble members converged into tighter agreement as PJM Western Hub Day-Ahead Peak Daily Fixed Price Futures were at $82.11 for January 29 and 30.
  • January 27: PJM Western Hub Day-Ahead Peak Daily Fixed Future Prices continued to increase to $819.93.
  • Delta: That’s 10x higher, or an extra $740/MWh, than when our MTF forecasts started showing signs of the cold weather.

PJM's load forecast for January 27, 2026.

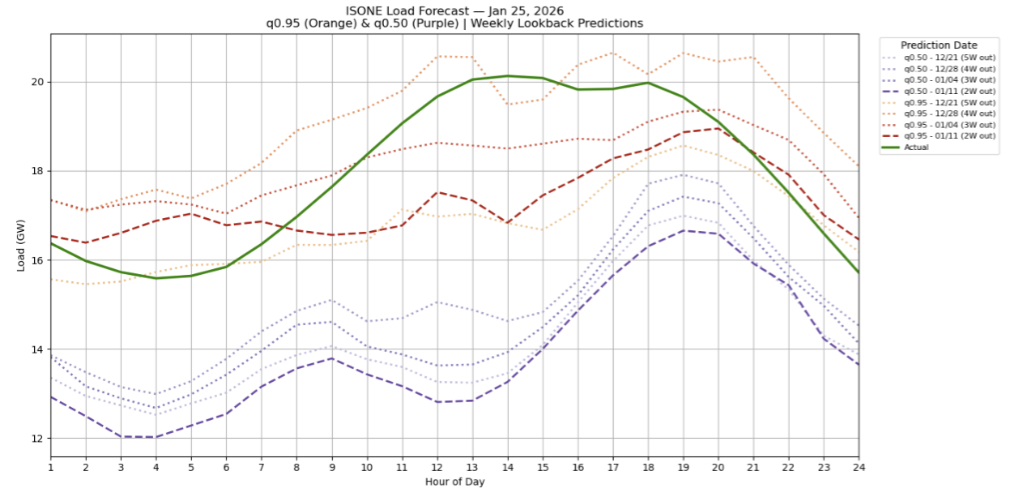
ISONE: A High-Confidence Cold Signal, Weeks Ahead of the Spike

Demand peaked at 20.1 GW on January 25 with continued elevated demand through the 30. But, again, Amperon’s MTF started showing signal well before prices adjusted.

MTF Signal Timeline

  • December 16: The MTF ensemble members first flagged ~20.1 GW demand for January 25 when ISONE Massachusetts Hub Peak Futures were around  $100 (Jan 25) and $143–$145 (Jan 26–27).
  • December 19: The P95 forecast reached 20.1GW for January 25.
  • December 23–28: The signal strengthened significantly, with multiple ensemble members and the P95 showing demand peaks around 20.1 GW as futures prices hovered around $112 for January 25 and $146-$152 for January 26-27.
  • January 23: ISONE Massachusetts Hub Day-ahead peak futures prices ranged from $315-$345.
  • Delta: That’s about $200 more from when our initial MTF forecasts started showing signs of the colder weather for next week.

ISONE's load foreast for January 25, 2026.

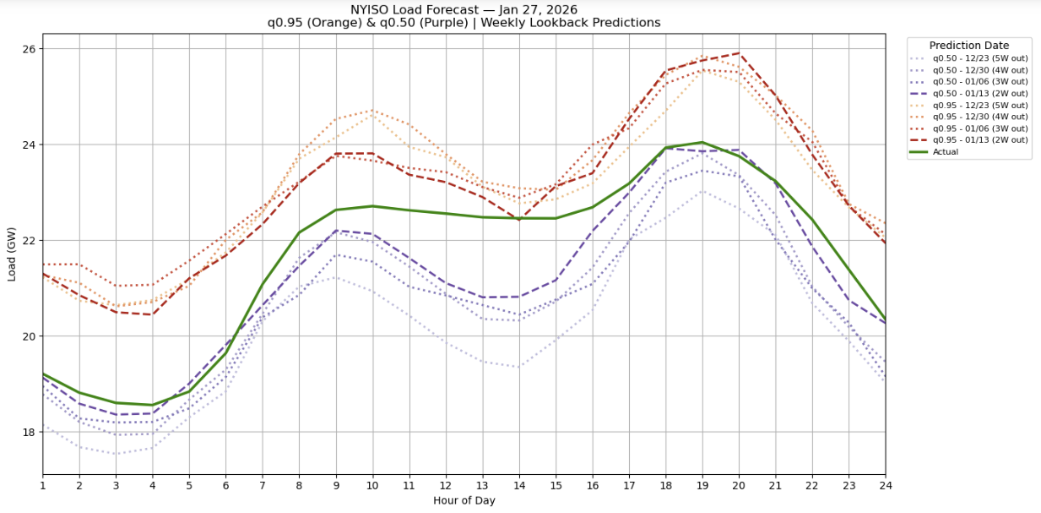
NYISO: Early Warnings Before Volatility Took Over

In NYISO, demand surpassed 23 GW on January 25 and 26 with the highest demand peaking at 24.0 GW on January 27 and 24.2 GW on January 30. But Amperon’s MTF was already highlighting upside risk in mid-December.

MTF Signal Timeline

  • December 18: The First MTF ensemble models showed ~24 GW peaks for January 30 as Zone J Day-Ahead Peak Daily Fixed Price Futures traded around  $116 (Jan 25) and $142 (Jan 26–27 and Jan 30).
  • December 21: The P85 forecasted demand to settle around reached 24 GW for January 27 and 30.
  • Christmas week: The signal was stronger and much more consistent with the P75-P80 expecting demand on January 27 and 30 to peak above 24 GW as NYISO Zone J Day-Ahead Peak Daily Fixed futures were around $138 (Jan 26–27 and 30)
  • January 23: Short-term forecasts showed dramatic day-over-day swings, reflecting how late the market processed the risk. Futures prices ranged from $394–$398 for January 26-27 and 30, almost triple from when our initial MTF forecasts started showing signs of the colder weather for next week.
  • January 29: Futures prices for tomorrow’s peak was $420.  
  • Delta: Prices more than tripled from when our initial MTF forecasts started showing signs of the cold weather.
NYISO's load forecast for January 27, 2026.

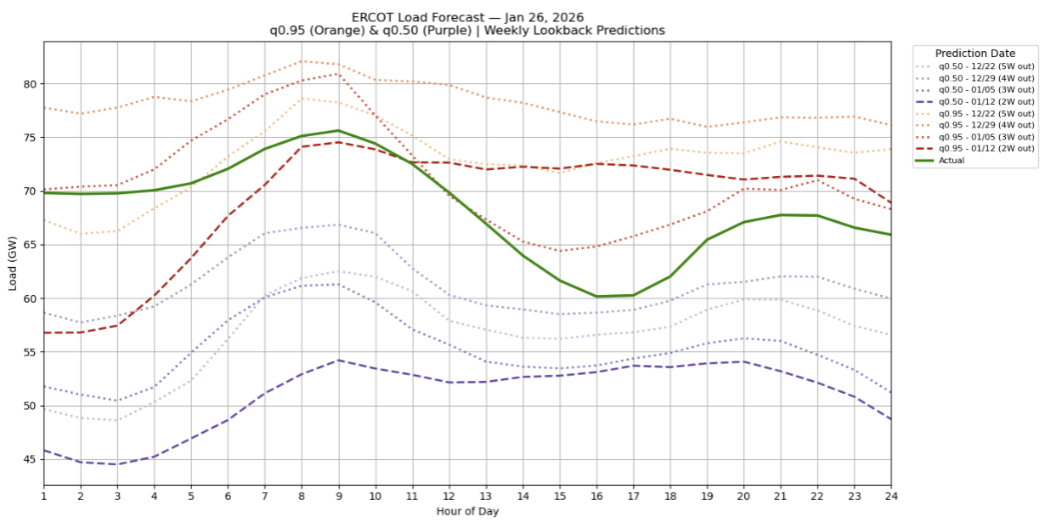
ERCOT: Early Signal, Explosive Price Reaction

Demand peaked on the morning of January 26 at 75.6 GW after a week of cold weather, but Amperon’s MTF was tracking it the whole way.  

MTF Signal Timeline

  • December 17: Multiple ensemble members and the P85-P90 showed peak demand around 75 GW on January 26th when prices for ERCOT North 345KV Hub Day-Ahead Fixed Futures were at $55.37.
  • Week of Christmas: The signal strengthened and became more consistent with the P85 consistently expecting demand on January 26th to peak around 75.6 GW.  Prices were still at $60.22.
  • January 23: Prices shot up to $765 as demand surged with Day-Ahead prices for January 25th clearing around $1,660.
  • Delta: Prices increased more than 10x from the MTF’s first signal.
ERCOT's load forecast for January 26, 2026.

Using Mid-and Short-Term Forecasts To Trade The Swings

As much as our MTF showed signals weeks in advance, there was still dramatic swings day over day. While it’s important to know when futures are low to buy, it’s just as important to know when prices are high to exit the position. Day-Ahead Peak Daily Fixed Price Futures for Zone J went from $103, $162-$171 on January 19th to $237–$257 on the 20th. While it’s important to know when futures are low to buy, it’s just as important to know when prices are high to exit the position. Amperon’s Mid-Term and Short-Term Forecasts gives you that insight to trade both sides of the swing.  

The Arctic blast underscores how quickly pricing can change once short-term forecasts confirm what mid-term fundamentals have already signaled. By identifying sustained cold risk weeks in advance, Amperon’s Mid-Term Demand Forecast gave traders more time to evaluate peak exposure, structure hedges, and navigate volatility before prices adjusted. In this market, time remains one of the most valuable inputs.

AI-driven Forecasting

Our advanced machine learning methodology delivers the accuracy you need to optimize operations and maximize profits.

  • 40K weather points from 4 vendors
  • 15-day short-term forecasts that update sub-hourly
  • Globally available
  • Leading UI/UX or API delivery
Book a demo

Want 3x more accurate forecasts? Let's talk.

Book a demo

Related articles

Left arrow icon for navigationRight arrow icon for navigation
Blog
February 2, 2026
Before the Cold Hit: Early Demand Signals Behind January’s Arctic-Driven Power Price Surge
Open article
Blog
February 2, 2026
Hedging Tail Risk: Term Traders Get a Powerful New Risk Management Tool
Open article
Blog
January 26, 2026
Sub-Hourly STF Improves Day-Ahead Positioning in the Era of Renewables
Open article
Blog
January 26, 2026
Behind PJM’s 800% Increase in Capacity Prices and Trump’s Emergency Auction Plan
Open article
Blog
January 8, 2026
Germany Proves Transmission is Just as Critical as Generation
Open article
Blog
January 8, 2026
How Amperon Won the Holidays
Open article
Blog
January 23, 2026
6 Grid Trends to Watch in 2026
Open article
Blog
December 12, 2025
Battery Energy Storage: ERCOT vs. CAISO
Open article
Blog
December 19, 2025
European Power Traders Finally Get One-Stop Forecasting
Open article
Blog
December 6, 2025
The Pacific Northwest Risks a 6 GW Shortfall This Winter
Open article
Blog
December 17, 2025
With Millions On the Line, Amperon Called Cold Snap 33 Days Out
Open article
Blog
December 5, 2025
Chilean Solar and Wind Asset Owners Face Hourly Reporting Under New Market Structure
Open article
Blog
December 5, 2025
Can PJM Keep Up with Exponential Load Growth?
Open article
Blog
December 5, 2025
US Winter Weather Outlook 2025–2026: Mild on Paper, Volatile in Practice
Open article
Blog
January 23, 2026
Ontario’s Day-Ahead Market is a Renewables Profitability Test
Open article
Blog
December 5, 2025
US Solar and Wind Curtailment Is Exploding
Open article
Blog
December 5, 2025
Navigating the RTC+B Paradigm Shift
Open article
Case study banner reading “Nailing MISO’s Fall 2025 Coincident Peak” with a computer displaying grid demand forecasts
Blog
December 5, 2025
Nailing MISO's Fall 2025 Coincident Peak: A Week-Ahead Perfect Call
Open article
Amperon MTF model visualization displaying market trends and forecasts
Blog
December 5, 2025
Unlocking Intelligent Term Trading and Seasonal Planning  
Open article
Blog post header with palm tree in hurricane winds asking Why Has This Hurricane Season Been So Quiet with Amperon branding
Blog
December 5, 2025
Why Has This Hurricane Season Been So Quiet?
Open article
Table showing parallel flow congestion scenarios across different energy markets including ISO/RTO, WEIM, WEIS, Markets+, and EDAM with scheduled delivery systems and mitigation strategies
Blog
December 5, 2025
CAISO Breaks the Transmission Hedge
Open article
Amperon blog post graphic asking High ERCOT Demand, Low Wind, and No Price Spike? with load forecast chart for August 18, 2025
Blog
December 5, 2025
High ERCOT Demand, Low Wind, and No Price Spike?
Open article
ISONE May hourly average load comparison chart showing data from 2023, 2024, and 2025 with peak loads around 13,534 MW at HE17-18
Blog
December 5, 2025
Electrification and BTM Solar: Reshaping Demand in ISO New England
Open article
Line graph showing MISO Net Load from 2022-2025 comparing hourly load patterns ranging from 50,000 to 90,000 MW across 24-hour period
Blog
December 9, 2025
The Rise of the Duck Curve in ERCOT: A Shift in Net Demand Peak and the Future of Solar Power Integration
Open article
Amperon market analysis titled Where's the Chaos? ERCOT's Surprisingly Quiet Summer with curved line graph showing peak demand trends from 2022-2025
Blog
December 5, 2025
Where’s the Chaos? ERCOT’s Surprisingly Quiet Summer
Open article
Amperon forecasted load versus prediction time by weather vendor chart for PJM on June 24, 2025, showing settled demand at 158.2 GW with multiple vendor forecasts (ENS_1, NBM, DTN, AG2)
Blog
December 8, 2025
PJM Breaks 10-Year Peak Load Record — and Amperon Saw It Coming 7 Days Out
Open article
Blog
December 8, 2025
PJM Forecast: June 23–25 Heat Wave May Shatter Summer Expectations
Open article
Blog
December 8, 2025
ISONE’s First Heat Spike of Summer- and Amperon Nailed It
Open article
Amperon whitepaper cover titled Cost of Uncertainty: The Challenges and Value of Accurate Price Forecasting with download button, dated March 2025
Blog
December 10, 2025
Why Wholesale Electricity Prices are ESPECIALLY Volatile in Texas
Open article
Blog
December 10, 2025
Powering Profitable Growth for Retail Electricity Providers: Turn Load Forecasting into Your Competitive Edge
Open article
Blog
December 10, 2025
Navigating ERCOT’s 4CP Program: Key Updates and Strategic Preparation for 2025
Open article
Amperon promotional banner announcing sub-hourly grid forecasts for European TSOs now available, featuring transmission tower with geometric orange and blue design elements
Blog
December 10, 2025
Europe’s Shift to 15-Minute Power Markets: How Amperon Helps You Prepare for Market Evolution
Open article
Amperon blog post graphic titled "The Shape Shift: How Texas Net Demand Transitions from Shoulder to Summer" with wind turbine image
Blog
December 10, 2025
The Shape Shift: How Texas Net Demand Transitions from Shoulder to Summer
Open article
Amperon presentation slide titled "ERCOT's Evolving Price Dynamics 2021-2024 Analysis" with sunset transmission tower image
Blog
December 11, 2025
ERCOT’s Evolving Price Dynamics [2021-2024 Analysis]
Open article
A promotional image announcing the introduction of real-time grid price forecasts now live in ERCOT, featuring Amperon branding
Blog
December 10, 2025
Amperon Expands Forecasting Capabilities with Real-Time Price Predictions in ERCOT
Open article
Blog
December 10, 2025
MISO’s VOLL Change Could Reshape Scarcity Pricing and Reliability Signals
Open article
Blog
December 10, 2025
Why Behind-the-meter Solar Complicates Spring Forecasting
Open article
Comparison table showing solar and wind forecasting capabilities across Machine Learning, Physics-based, and Amperon (ML+PB) approaches for partial asset metadata, soiling, equipment degradation, biased weather, and curtailment
Blog
December 10, 2025
How to Forecast Energy Generation for Wind or Solar Assets
Open article
Day-ahead grid MAPE summary table for 2024 showing 12-month average comparison of ISO MAPE, Amperon MAPE past models, current models, and improvement percentages across multiple ISOs (AESO, CAISO, ERCOT, ISONE, MISO, NYISO, PJM, SERC, SPP, CH, DK, ES, IE)
Blog
December 10, 2025
Always Innovating: Amperon’s New Techniques to Improve Energy Forecasting
Open article
Amperon recap slide for April 7 titled "Why prices in ERCOT soared to $4000 per MW" with pastoral field landscape at golden hour
Blog
December 10, 2025
High Net Demand and Outages Caused Recent Price Spike in ERCOT
Open article
Amperon ebook promotional banner "Price Forecasting: Cost of Uncertainty - The Challenges and Value of Accurate Price Forecasting" with free ebook download button on gradient blue-green background
Blog
December 10, 2025
Are ERCOT’s morning ramp DA prices really higher than summer?
Open article
Infographic titled "Types of Data Relevant to Both Solar and Wind Assets" showing three categories: Nameplate Capacity, Location of Asset, and Historic Curtailment with wind turbines and solar panels imagery
Blog
December 10, 2025
Inside our Data: Intro to Renewable Asset Data
Open article
Amperon promotional slide "Adapting to OMIE's 15-Minute Transition: How Granular Forecasts Can Help You Stay Ahead" with laptop showing asset-level solar sub-hourly forecast for January 12, 2025
Blog
December 10, 2025
Adapting to OMIE’s (Portugal and Spain) 15-Minute Transition: How Granular Forecasts Can Help You Stay Ahead
Open article
Blog
December 11, 2025
What the beginning of daylight savings time means for peak pricing
Open article
Amperon presentation slide "How the Grid Changed in 2024" with aerial view of large-scale solar farm installation in agricultural setting at sunset
Blog
December 11, 2025
How the Grid Changed in 2024
Open article
Amperon recap slide for February 14-20 titled "Another cold week on the grid, another good week for Amperon's demand forecasts" with wind turbines in snowy landscape
Blog
December 11, 2025
Another cold week on the grid, another good week for Amperon’s demand forecasts
Open article
Blog
December 11, 2025
The Future of Western Power Markets: Why Implementing a Day-Ahead Market Matters
Open article
Blog
December 11, 2025
Harnessing the power of sub-hourly and hourly forecasts for wind assets
Open article
Blog
December 11, 2025
Forecasting for the Super Bowl: How much does the big game really affect demand?
Open article
Amperon promotional banner stating "33% more accurate in MISO" with blue gradient background and solar panels with wind turbines imagery
Blog
December 11, 2025
Best Demand and Net Demand Forecasting Calls to End 2024
Open article
Amperon slide featuring Punxsutawney Phil prediction reference titled "What Punxsutawney Phil's prediction for 6 more weeks of winter really means for the grid" with snowy groundhog image
Blog
December 11, 2025
What Punxsutawney Phil’s prediction for 6 more weeks of winter really means for the grid
Open article
Blog promotional graphic on navy background titled "New Blog: Why a hybrid regression/ML approach outperforms in energy forecasting" with layered visualization showing Linear Regression, Boosted Trees, and Additional secondary models
Blog
November 18, 2025
Why a hybrid regression/ML approach outperforms in energy forecasting
Open article
Blog
June 3, 2025
Europe 2024 Best Amperon Forecasting Calls and Trends to Watch
Open article
Title slide reading "Part 1: Inside Our Data: The Importance of Granular Weather Data" by Lily Bowdler from Amperon
Blog
November 18, 2025
Inside our Data: The Importance of Granular Weather Data
Open article
Bar chart showing 2025 Highest ISO Demand Levels So Far across four ISOs: ERCOT (68.9 GW), PJM (126.8 GW), MISO (97.9 GW), and SPP (43.1 GW)
Blog
November 18, 2025
Déjà vu? With one cold snap down, will we have a repeat of last MLK weekend?
Open article
Blog promotional slide "The first winter cold snap is here, but will it break records?" with laptop displaying PJM weather data showing 5-year, 10-year, and 30-year normals for various cities
Blog
November 18, 2025
First winter cold snap is here, but will it break records?
Open article
Blog
June 3, 2025
Looking Back (and Ahead): A Year-end Q&A with Amperon CEO Sean Kelly
Open article
Line graph comparing Ireland Wind Generation forecasts for August 20-26, showing Actual Wind, Amperon Day Ahead Wind Forecast, and EirGrid Day Ahead Wind Forecast (duplicate of image 43)
Blog
November 18, 2025
How strong winds in Ireland left power market stakeholders exposed
Open article
Line graph of CAISO demand for Indigenous Peoples Day 2024 (October 11-14), showing Duck Curve pattern and comparing Amperon Day Ahead, ISO Day Ahead, and Actuals
Blog
November 18, 2025
Forecasting for the holidays: How holidays affect demand patterns
Open article
Blog
June 3, 2025
When tech buys nuclear, who wins?
Open article
Blog
November 18, 2025
Unlocking new standards in solar forecasting to maximize asset efficiency
Open article
Marketing graphic titled "What's Happening with Price Forecasting? A Q&A with Amperon CEO Sean Kelly" featuring professional headshot of Sean Kelly
Blog
November 18, 2025
What’s Happening with Price Forecasting? A Q&A with Amperon CEO Sean Kelly
Open article
Blog
November 18, 2025
Taking Advantage of Amperon’s Net Demand Forecast on Snowflake
Open article
Line graph showing ES (Spain) Demand for August 15 Feast of Assumption, with table comparing Peak Demand, Amperon APE, and ES APE percentages across four dates, plus lower panel showing electricity production and spot prices
Blog
November 18, 2025
2024 Energy Demand Trends: What Happened During 3 Recent EU Holidays
Open article
Blog
June 3, 2025
PJM Capacity Auction: Record Pricing and Delays
Open article
Multi-panel visualization showing ERCOT Demand for July 1-5, including line graphs comparing Amperon and ERCOT forecasts, data tables showing MAPE percentages for different dates, and gauge charts showing average MAPE (1.02% AMP, 1.69% ISO)
Blog
November 18, 2025
Amperon’s best energy forecasting calls for Summer 2024
Open article
Marketing text overlay on transmission tower background stating "Amperon's new price forecast tackles ERCOT's volatility and helps market participants mitigate risks"
Blog
November 18, 2025
Amperon’s new price forecast tackles ERCOT’s volatility and helps market participants mitigate risks
Open article
Marketing graphic announcing "Expanding Amperon's coverage on Snowflake" for Demand and Net Demand across North America and Europe ISO/TSOs, featuring screenshot of Snowflake marketplace interface
Blog
November 18, 2025
Expanding Amperon’s coverage on Snowflake: Demand and Net Demand for North America and Europe ISO/TSOs
Open article
Video thumbnail from webinar titled "Powering Data-Driven Decisions: Enhance Your Energy Trading Game with Amperon + Snowflake" featuring Amperon and Snowflake logos, dated September 26, 2024, with transmission tower image and video progress indicator show
Blog
November 18, 2025
Powering Data-Driven Decisions: Enhance your energy trading game with Amperon & Snowflake
Open article
Photograph of single wind turbine on hilltop with autumn-colored foliage in foreground against clear blue sky
Blog
November 18, 2025
Analysis of spring curtailments in preparation for fall
Open article
Marketing graphic announcing "Introducing Asset-Level Wind Short-Term Forecasts" with photograph of wind turbines against mountain landscape backdrop
Blog
November 18, 2025
Expanding generation forecast capabilities into wind
Open article
ERCOT West Zone Net Demand Short-Term Forecast for August 11-13, 2024, showing three stacked area graphs for Net Demand, Solar Generation, and Wind Generation, with explanatory text about negative net load, curtailments, and congestion implications
Blog
November 18, 2025
Granular insights from grid net demand forecasts: Importance of zone-level forecasting
Open article
Blog
December 2, 2025
Why solar forecasts and accuracy metrics are a big deal
Open article
Satellite view from space showing large hurricane system with visible eye wall approaching Caribbean islands, showing Earth's curvature against black space background
Blog
November 18, 2025
Weaker hurricane season due to Saharan dust
Open article
Close-up photograph of solar panel array showing dust, dirt, and debris accumulation on photovoltaic panel surfaces, demonstrating need for maintenance
Blog
November 18, 2025
Hailstorms: How they can impact your solar farm
Open article
Nighttime satellite image showing hurricane system with well-defined spiral structure making landfall on southeastern United States coastline with visible city lights
Blog
November 18, 2025
Forecasting for SERC During Tropical Storm Debby
Open article
Photograph of dark chalkboard filled with mathematical equations, formulas, and diagrams including algebraic expressions, chemical structures, geometric drawings, and calculus notations written in white chalk
Blog
November 18, 2025
The different kinds of forecasting metrics
Open article
Blog
November 18, 2025
Amperon’s industry-leading forecasts now available to transact on the Microsoft Azure Marketplace
Open article
Aerial photograph of wind farm installation with three large white wind turbines on rolling green hills with mountains in background and scattered buildings in rural landscape
Blog
November 18, 2025
Reminiscing on the summer’s heat waves... so far
Open article
Marketing graphic announcing "Introducing Solar Sub-Hourly Generation Forecasts" with photograph of solar panel installation on ground-mounted framework in grassy field
Blog
November 18, 2025
Harnessing sub-hourly solar forecasts for power markets trading
Open article
Blog
November 18, 2025
Amperon’s methodologies: AI-powered forecasting for the energy transition
Open article
Blog
June 3, 2025
The Double-Edged Sword: Using LLMs in Electricity Market Forecasting
Open article
Satellite image of two tropical cyclone systems near Asian coastline showing clear hurricane eyes and spiral cloud formations over ocean waters with land mass visible on left side
Blog
November 18, 2025
Advanced stress testing for extreme weather
Open article
Blog
June 3, 2025
Enabling Amperon’s short-term grid forecast with Snowflake
Open article
Upward angle photograph of tall electrical transmission tower structure against blue sky with white clouds, showing multiple levels of power line connections and lattice framework construction
Blog
November 18, 2025
Amperon’s best forecasting calls this Spring
Open article
PJM heat wave peak demand forecast comparison table showing Amperon APE vs PJM APE for June 18-23
Blog
November 18, 2025
PJM Heatwave Analysis: Forecasting for 90-degree heat and a new federal holiday
Open article
Seattle city skyline at night featuring the Space Needle with illuminated buildings
Blog
November 18, 2025
A deep dive into what happened MLK weekend in the Pacific Northwest and West Coast
Open article
30-year temperature normals table showing forecasts for cities from Newark to Rockford, June 12-26
Blog
November 18, 2025
June 2024 heat wave - PJM
Open article
Houston demand chart showing May 16 power outage affecting 1 million people with Amperon's weather actuals vs actual load
Blog
November 18, 2025
Storm Analysis: ERCOT’s intense may weather
Open article
Amperon blog header image asking "What is the true carbon impact of your renewable assets?" with solar panels and wind turbines
Blog
November 18, 2025
What is the true carbon impact of your renewable assets?
Open article
White electric fan with yellow and blue ribbons blowing against bright yellow background
Blog
November 18, 2025
Record summer heat is coming, is the grid – and your company – prepared?
Open article
Blog
June 3, 2025
The Western Interconnection’s big day-ahead decision
Open article
Amperon promotional banner introducing Ensemble Forecast and Advanced Weather Package with laptop display
Blog
November 18, 2025
Introducing Amperon's Ensemble Forecast, NBM Integration, and Advanced Weather Package
Open article
Aerial view of large-scale solar panel farm with organized rows in rural landscape
Blog
November 18, 2025
Coincident peak season is coming
Open article
Desert landscape with red sand, sparse vegetation, and blue cloudy sky
Blog
November 18, 2025
WRAP: New forecasting requirements for Western states’ resource adequacy coalition
Open article
Magnifying glass on business charts and graphs with eyeglasses, representing data analysis
Blog
November 18, 2025
Amperon’s 6 best forecasting calls in 2024 so far
Open article
Power transmission towers and lines crossing snow-covered winter landscape under blue sky
Blog
November 18, 2025
How stable is our grid?
Open article
Total solar eclipse showing sun's corona around dark moon disc against black sky
Blog
November 18, 2025
How the solar eclipse will affect grid stability
Open article
Blue ethernet cable with US hundred dollar bills representing energy cost savings and electricity pricing
Blog
November 18, 2025
The economics of the clean energy transition
Open article
Blog
June 3, 2025
How weather impacts energy demand & prices
Open article