

Executive Summary
All demand forecasts give power traders an important window into the future, but traditional forecasts have a key limitation: they can’t describe how likely an extreme scenario is. This leaves traders guessing, often resulting in over- or under-hedging. With the advent of probabilistic forecasting methods, traders can use data—continuously calibrated to real-world actuals, not just historical analogues—to quantify and hedge against “tail risk,” or exposure to extreme events. In a world where power markets are increasingly subject to both variable generation and changing load dynamics, quantifying uncertainty can mean the difference between managing risk intelligently and hedging blindly.
Limitations of Deterministic Forecasting
A single-number forecast, or even a collection of unweighted ensemble runs, can create a false sense of precision. Power traders often anchor on a median ensemble run because it appears moderate or centered, but the median is not a probability‑weighted expected value. It is simply one scenario in the spread.
When a trader is structuring a summer hedge based on a mild deterministic forecast, the presence of several ensemble members hinting at extreme heat carries no quantified meaning. The trader sees the possibility of a heat event, but not the probability of it.
And that distinction is everything. Without probabilities, traders cannot quantify risk, measure exposure, or understand the true shape of uncertainty. They are left to interpret a cloud of scenarios without any statistical grounding, which forces them to rely on intuition rather than measurable risk.
This blind spot becomes especially dangerous when dealing with “tail risk,” or unhedged exposure to low‑probability, high‑impact events. A deterministic forecast cannot quantify the likelihood of these events. It can only show that they exist somewhere in the ensemble spread.
For many term traders, that unweighted visibility is not enough. Without probabilities, they cannot easily distinguish between a 5% risk and a 20% risk, even though the financial implications of that difference are enormous.
Probabilistic Forecasting: An Overview
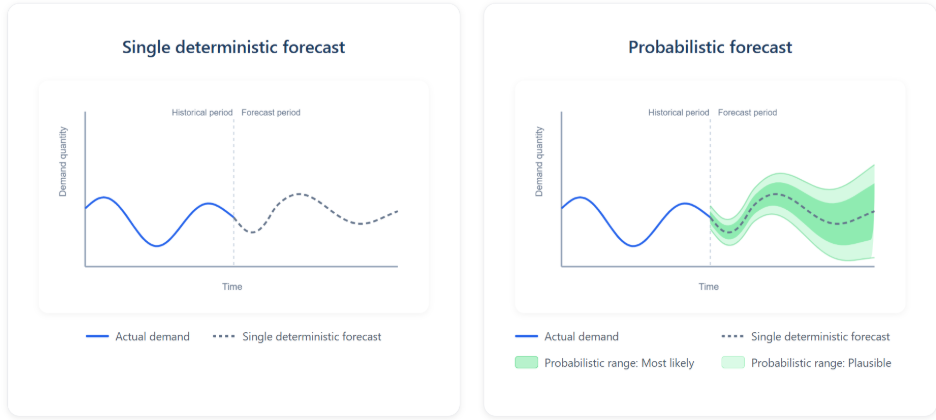
Instead of showing only possibilities, a probabilistic forecast quantifies probabilities, giving traders a statistically grounded view of uncertainty and enabling risk‑weighted decision‑making.
At its core, a probabilistic forecast provides a range of potential outcomes, each paired with a confidence level that reflects the likelihood of that outcome. This approach transforms forecasting from a directional guide into a verifiable decision support tool.
Quantiles: The Building Blocks of Probabilistic Forecasts
Probabilistic forecasts express uncertainty through quantiles, which represent specific confidence levels. Each quantile corresponds to the percentage of outcomes expected to fall below that value:
- P50 indicates that 50% of outcomes are expected to fall below that value.
- P95 indicates that 95% of outcomes are expected to fall below that value.
- P5 indicates that 5% of outcomes are expected to fall below that value.
Quantiles are also powerful when interpreted as ranges. For example, the P10–P90 range represents a span within which 80% of outcomes are expected to fall. Rather than saying “load could be anywhere from X to Y,” a probabilistic forecast can say, “there is an 80% chance load will fall between X and Y.”
This confidence level or range makes the forecast far more actionable. The key advantage is that these ranges carry probabilistic meaning, unlike deterministic ensemble spreads, which simply show that load could fall between those values without indicating how likely that is.
By providing quantiles across the full distribution, probabilistic forecasts allow traders to evaluate not just the central expectation, but the entire shape of uncertainty—where the tails are, how wide the distribution is, and how risk accumulates across different outcomes.
A probabilistic approach enables true probability-weighted optimization of trading positions and hedging strategies. This minimizes “gut feeling” decisions and arbitrary buffers, enabling traders to construct portfolios that maximize expected value while constraining downside risk to acceptable levels.
Quantifying the Value of Probabilistic Forecasts
Term traders constantly struggle with the question of how much seasonal capacity to contract months in advance. Using a deterministic forecast, they might procure at the expected level and hope for the best, add an arbitrary safety margin, or structure hedges based on intuition.
With probabilistic forecasts, they can quantify exposure based on data continuously calibrated to real-world events. Unlike deterministic forecasts that provide single-point predictions or unweighted ensembles, probabilistic forecasts reveal and quantify risk with mathematical precision.
Let’s explore an example for a trader in ERCOT preparing for a hypothetical summer peak:
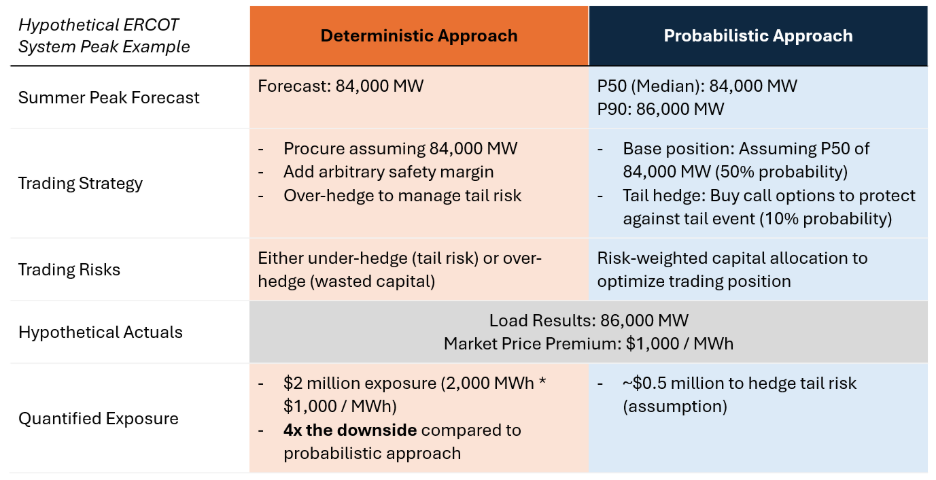
The decision to buy options or retain flexible generation becomes a quantifiable calculation rather than guesswork. The trader isn’t planning for one future, but instead planning for multiple scenarios with quantified likelihoods and allocating risk and capital efficiently across the distribution rather than over-hedging or leaving tail risk unmanaged.
This doesn’t inherently reduce risk, as the underlying uncertainty in weather and grid conditions remains unchanged. It does, however, quantify risk, providing measurable exposure metrics that can be traded in power markets, mitigated through hedging, or retained with measured tolerance. This quantification fundamentally changes the nature of term trading and seasonal load risk planning.
In term trading, where the difference between P10 and P90 outcomes can represent millions of dollars in exposure, the ability to quantify these scenarios and trade them with measured confidence isn’t just valuable—it can mean the difference between managing risk intelligently and hedging blindly.
Applying Probabilistic Forecasting
Probabilistic forecasting represents a paradigm shift in how power market participants evaluate and act on uncertainty. Rather than asking what is most likely to happen, decision makers can assess a range of outcomes with explicit likelihoods. This allows exposure to be quantified, compared, and managed directly rather than inferred indirectly.
In practice, this means shifting from expectation-based planning to risk-aware optimization. Positions can be sized based on probability-weighted outcomes, and hedging strategies can be aligned explicitly with an organization’s risk tolerance.
Probabilistic Forecasting for Utilities, Financial Traders, and Gentailers
Utilities and Must-Serve Load: Reliability-First Planning
Load-serving entities and other must-serve obligations operate under strict reliability constraints. For these participants, the primary risk is not forecast error itself, but the cost and consequences of under-forecasting demand. Shortfalls can result in emergency procurement at unfavorable prices, exposure to scarcity events, or regulatory and reputational consequences.
In this context, probabilistic forecasts provide a disciplined framework for planning against downside risk. Rather than relying on a single conservative forecast or ad hoc stress testing, planners can explicitly reference higher quantiles to ensure adequate coverage at a defined probability level. These quantiles represent demand levels that are unlikely but plausible, allowing reliability targets to be met without systematically over-procuring capacity.
Importantly, probabilistic forecasts allow must-serve entities to differentiate between routine uncertainty and true tail risk. In practice, this approach replaces static planning margins with dynamic, data-driven risk buffers that evolve with forecast uncertainty.
Speculative Traders: Asymmetric Risk and Upside Capture
Speculative trading strategies operate under fundamentally different objectives. For traders seeking to express directional views or capture optionality, being wrong is acceptable—sometimes expected—as long as the payoff profile justifies the risk.
Probabilistic forecasts enable these strategies by making downside and upside asymmetry explicit. Rather than anchoring on the expected value (P50), speculative positions may reference lower quantiles such as the P20 or P30 when positioning for upside scenarios, particularly during periods when market pricing does not fully reflect low-probability outcomes.
For example, a trader may identify a scenario where market prices implicitly assume median load outcomes, while probabilistic forecasts indicate meaningful probability mass in lower-demand regimes. By sizing positions based on these quantiles, traders can quantify the likelihood of success, the magnitude of potential drawdowns, and the expected value of the trade under multiple outcomes.
Crucially, probabilistic forecasts allow speculative risk to be measured rather than assumed. Instead of relying on intuition or loosely defined scenarios, traders can assess how often similar outcomes occurred historically under comparable forecast distributions, enabling more disciplined risk allocation.
Gentailers and Balanced Portfolios: Expected Value with Tail Protection
Most market participants operate somewhere between strict reliability constraints and pure speculation. For balanced portfolios—such as gentailers, utilities with discretionary trading exposure, or integrated energy firms—the goal is to optimize expected value while managing tail risk on both sides of the distribution.
In these cases, the median forecast (P50) typically serves as the anchor for planning and valuation. However, probabilistic forecasts add significant value by quantifying the dispersion around the median. Lower and upper quantiles (e.g., P20–P80) can be used to structure hedges, stress test portfolio exposure, and evaluate worst-case outcomes under adverse conditions.
This enables a layered risk management approach. Core positions are aligned with expected outcomes, while tail exposures are identified and mitigated through targeted hedging or optionality. Rather than over-hedging across all scenarios, capital is deployed selectively where forecast uncertainty indicates material risk.
For gentailers in particular, probabilistic forecasts support joint optimization across generation assets and retail obligations. By aligning physical dispatch, forward sales, and financial hedges with probabilistic demand distributions, portfolios can be structured to perform robustly across a wide range of market conditions.
Aligning Forecasts to Risk/Reward Profiles
Across all stakeholders, the key shift enabled by probabilistic load forecasting is the transition from forecast consumption to risk-based decision making. Participants are no longer forced to debate which single forecast is “correct.” Instead, they can select outcomes consistent with their unique risk tolerance, quantify the financial implications of being wrong, and size positions accordingly.
In term trading environments, where decisions must be made months in advance and uncertainty compounds over time, this capability is particularly valuable. Probabilistic forecasts transform uncertainty from an opaque threat into a measurable input, enabling more resilient strategies, improved capital efficiency, and clearer alignment between forecasts and business objectives.
Probabilistic MTF Methodology
Amperon’s probabilistic mid-term forecast uses a proprietary 3-step modeling framework that transforms ECMWF’s weather ensembles into 51 deterministic load scenarios, then trains on statistical features and historical forecast performance to generate calibrated probabilistic forecasts that correct for systematic biases.
Amperon’s Approach to Probabilistic Forecasting
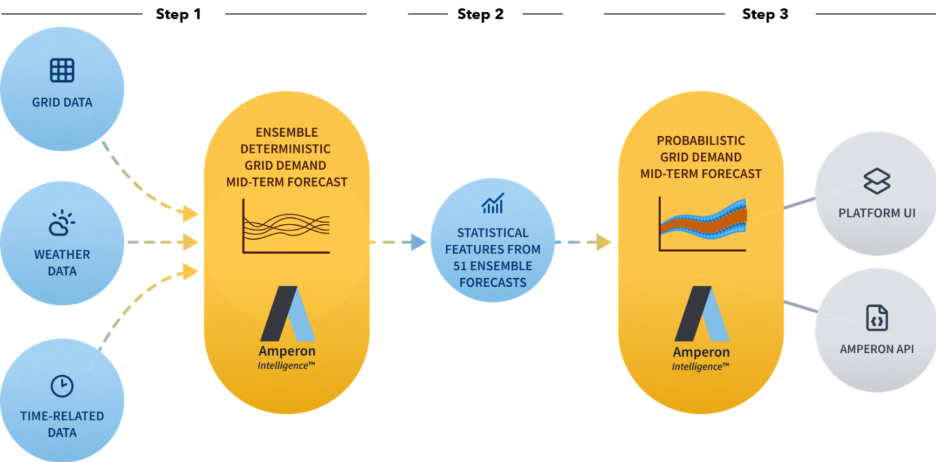
Step 1: Create 51 Ensemble Load Forecasts
We build deterministic grid demand mid-term forecasts using ECMWF’s sub-seasonal and seasonal weather ensembles. With their 50 ensembles + 1 control weather forecast, we create a full range of load outcomes up to 7 months out. These ensemble load forecasts model the weather-to-load relationships based on Amperon’s existing machine learning (ML)-based load model stack and the industry standard weather inputs from ECMWF.
Step 2: Create Statistical Features from 51 Ensemble Load Forecasts
We compare historical forecast performance of the 51 ensemble load forecasts to actuals and extract statistical features including distribution statistics, spread metrics, and temporal context:
- Distribution statistics: mean, median, standard deviation, etc.
- Ensemble quantiles and spread metrics: quantiles of 51 ensembles, range, spread, coefficient of variation, etc.
- Temporal context: hour, day, holidays, season, etc.
Step 3: Calibrate and Learn from Forecast Errors
The key differentiator in our approach lies in training our probabilistic models not only on weather-to-load relationships, but on statistical features derived from the forecast errors of the 51 deterministic load forecasts.
To identify and correct for systematic errors, we built regression models for each probability quantile and trained them on historical backtest data spanning 60,000 training examples per region where past ensemble load patterns are compared against actual load outcomes.
What makes this approach powerful is that each quantile doesn’t simply learn the pattern of “when temperature is X, load is Y”, but also “when the ensemble shows pattern X and past forecasts exhibit error pattern Y, apply correction factor Z.”
These correction factors significantly improve the forecast precision of each quantile regression by fixing systematic errors that deterministic forecasts consistently make due to biases in weather data and load models.
We’ve observed specific instances of this powerful learning and self-calibration when factoring in summer heatwave and shoulder season forecasting:
- Summer heatwave under-estimation: Training data showed that when mean temperatures exceeded high thresholds and ECMWF weather ensemble spreads were in high agreement, deterministic forecasts consistently under-estimated actual load. While ECMWF ensembles showed consensus of a hot afternoon, load models failed to capture the non-linear spike in air conditioning demand. Our quantile regression models learned to automatically correct future forecasts when similar ensemble characteristics and temperatures were observed.
- Shoulder season uncertainty: Spring and fall seasonal transition periods also pose a forecasting challenge. Training data failed to accurately model the uncertainty of human behavior during shoulder seasons; while some customers still run heat, others may open windows. This behavior isn’t well captured when solely relying on weather-to-load models. Our quantile models learned to add uncertainty in the prediction intervals to accurately incorporate this inherent behavioral variation during shoulder seasons.
The result is a probabilistic mid-term load forecast that combines the best of both ensemble forecasting and machine learning:
- Ensemble forecasting captures weather-driven extremes that may not appear in training data.
- Machine learning learns complex correction patterns from historical forecast errors
Evaluating Probabilistic Models
Load forecasting in power markets has historically been evaluated using deterministic accuracy metrics such as Mean Absolute Percentage Error (MAPE) or Root Mean Squared Error (RMSE). These metrics are well-suited to point forecasts, where the objective is to predict a single realized outcome as closely as possible. However, they fail to capture the risk—and the value—embedded in probabilistic forecasts.
MAPE answers a narrow question: how close was the forecast to the realized load? For term trading and risk management, this question is incomplete. Market participants need to understand not only whether a forecast could be wrong, but how wrong it could be and with what likelihood.
A probabilistic forecast that correctly characterizes uncertainty may occasionally miss the realized outcome while still providing substantial decision value. Conversely, a point forecast with low error metrics can be actively misleading if it underestimates tail risk.
As a result, probabilistic load forecasts require evaluation frameworks that assess the accuracy, reliability, and consistency of the full forecast distribution rather than a single expected value.
Probabilistic Model Evaluation Metrics
Quantile Loss Measures Distributional Accuracy
To evaluate probabilistic forecasts, we rely in part on quantile loss. Quantile loss, sometimes referred to as pinball loss, measures how well each forecasted quantile aligns with realized outcomes by penalizing errors asymmetrically.
Under-prediction is penalized more heavily at higher quantiles, while over-prediction is penalized more heavily at lower quantiles. This structure mirrors the economic reality of power markets, where being wrong in the tails often carries disproportionately large financial consequences.
Quantile loss is calculated independently for each forecasted quantile, then averaged across all quantiles and forecast horizons. This average quantile loss provides a holistic measure of distributional accuracy, capturing both central tendencies and tail behavior.
Unlike deterministic metrics, quantile loss directly rewards forecasts that correctly represent uncertainty, making it a natural choice for evaluating models intended for risk-weighted decision making.
Improvements in quantile loss, particularly at the extremes of the distribution, indicate meaningful gains in the model’s ability to represent risk rather than simply fitting historical averages.
Coverage Measures Reliability
While quantile loss evaluates accuracy, coverage metrics evaluate reliability. For term traders, reliability is just as impactful as accuracy. For probabilistic forecasts to be useful, their quantiles must be well‑calibrated, meaning observed outcomes should match predicted probabilities.
Coverage, sometimes called coverage reliability or coverage error, measures whether forecasted probabilities align with observed outcomes over time. For example, a P90 forecast should be exceeded by realized load approximately 10 percent of the time, while a P50 forecast should be exceeded approximately half the time.
This calibration process ensures that the probabilistic forecast is not just producing a distribution, but producing one that accurately reflects real‑world uncertainty. A well‑calibrated probabilistic forecast instills confidence that stated probabilities represent the true likelihood of future outcomes.
Reliable probabilistic forecasts exhibit consistent coverage across quantiles, regions, and seasons. Systematic deviations from expected coverage indicate over-confidence or under-confidence in the forecast distribution, both of which can materially degrade trading performance.
Over-confident forecasts underestimate risk and expose portfolios to unanticipated losses, while overly conservative forecasts dilute opportunity and reduce capital efficiency.
Coverage reliability is therefore a critical requirement for deploying probabilistic forecasts in operational and trading environments, where repeated small miscalibrations can compound into significant financial impacts.
Amperon’s Probabilistic MTF Performance
Tail Quantile Performance
Backtests of Amperon's Probabilistic Grid Demand Mid-Term Forecast demonstrate strong and consistent performance in the tails of the load distribution across both PJM and ERCOT.
In PJM, average quantile loss for extreme quantiles (P5, P10, P90, and P95) is materially lower than for central quantiles, indicating that tail behavior is being learned explicitly rather than absorbed into broad forecast error. Importantly, tail quantile loss increases smoothly with lead time, without the sharp degradation that is often observed when extreme outcomes are under-modeled.
In ERCOT, tail performance exhibits similar characteristics, with tail quantile loss remaining well-behaved across the forecast horizon despite the system’s higher weather sensitivity and non-linear demand response dynamics. This stability suggests that the probabilistic model is capturing structural drivers of extreme load outcomes rather than relying on reactive widening of uncertainty.
Coverage results reinforce these conclusions by demonstrating strong statistical reliability in the model’s tail probabilities. In PJM, coverage errors for the P90 and P95 quantiles average approximately 1–2%, indicating that extreme demand realizations occur very close to their stated probabilities. Deviations of this magnitude are well within expectations for applied probabilistic forecasting and are consistent with a well-calibrated distribution rather than systematic bias. At this level of accuracy, tail probabilities can be used confidently for downside risk assessment and forward planning without introducing meaningful distortion into risk-weighted decisions.
ERCOT shows similarly strong behavior, with tail coverage errors remaining below 3% on average and improving for shorter forecast horizons. Coverage deviations of this size are small relative to the inherent uncertainty being modeled and remain sufficiently tight to preserve the practical meaning of high-quantile forecasts. In both markets, these results indicate that forecast probabilities are statistically consistent with observed outcomes, supporting the use of tail quantiles as credible inputs for term trading, hedging, and risk budgeting decisions. For term trading, this level of tail reliability is critical, as it enables explicit downside and upside risk budgeting rather than reliance on conservative heuristics.
Middle Quantile Performance
Middle quantiles (P40–P60) also remain tightly calibrated in both ISOs, preserving forecast sharpness and expected-value integrity.
In PJM, average quantile loss for the middle of the distribution is higher in absolute terms than for tail quantiles, which is expected given the higher density of realizations near the median. However, loss values remain highly stable across zones and forecast lead times, with no evidence of systematic drift or widening dispersion. This indicates that enhancements in tail modeling are not being achieved by sacrificing central forecast quality or introducing excess noise into the distribution.
ERCOT exhibits a similar pattern. Middle-quantile loss remains well-controlled across the forecast horizon, and empirical coverage for P40–P60 tracks closely to nominal expectations, typically deviating by only a few percentage points. While these deviations are marginally larger than those observed in the extreme quantiles, they are symmetric and time-stable, indicating random variability rather than structural bias.
Crucially, the P50 forecast continues to behave as a true median outcome. Realized load exceeds the P50 forecast at approximately the expected frequency, confirming that the distribution is correctly centered rather than skewed upward or downward. This property is essential for valuation and planning use cases, where even small systematic biases in the central estimate can compound into material financial impacts over long horizons.
This balance between tail fidelity and central stability is critical for term trading workflows. Traders must be able to trust the expected outcome while simultaneously quantifying downside and upside exposure. The probabilistic model’s performance in the middle quantiles ensures that explicit risk management does not come at the expense of expected-value confidence.
The Future of Term Trading
Energy markets don’t just reward accuracy; they reward risk management. Measuring risk helps traders determine how aggressive to be and how much to hedge. Understanding scenario likelihood helps traders capture opportunity—and avoid losing it all during extreme events.
To meet this need, probabilistic forecasting will become the standard for term traders. The difference between deterministic and probabilistic forecasting can be exemplified in one simple comparison:
- Deterministic: “Load could be anywhere from X to Y.”
- Probabilistic: “We are 80% confident load will be between X and Y.”
This shift is transformative: the forecast becomes an actionable tool for portfolio optimization rather than simply an input. Armed with well-calibrated probabilities, traders can adopt a risk-weighted decision-making approach that aligns with their organization’s risk tolerance.
Specifically, Amperon expects term traders’ strategies to evolve in 5 distinct ways:
- Embracing range-based strategies rather than point forecasts
- Quantifying tail risk and understanding its impact on the book
- Optimizing hedge ratios using probability-weighted economics, not gut feelings
- Stress testing with quantiles, running P&L scenarios across P10, P50, and P90
- Monitoring forecast evolution, as spread changes can signal regime shifts
Over time, the entire industry will adopt a risk-weighted approach to account for inherent uncertainty. Risk management frameworks will evolve to use quantile-based planning. Financial products such as options and weather derivatives will evolve to reflect probabilistic forecasts. Investors will measure both returns and the risk that those returns will be wiped out by future events.
Risk-weighted trading strategies capture opportunities while protecting margins. By grounding decisions in calibrated probabilities rather than intuition, traders can scale exposure up or down with intention, align hedge volumes to the true shape of uncertainty, and ultimately deploy capital where it delivers the greatest risk‑adjusted returns.
Conclusion
Probabilistic mid-term forecasting gives term traders and seasonal planners something they’ve never had before: a data-driven view of how extreme events could impact reliability and financial performance. By showing not just what could happen, but the likelihood of various projected outcomes, probabilistic forecasting empowers traders to make decisions aligned with their organization’s unique risk/reward profile—decisions based on quantified risk rather than intuition or overly conservative safety margins. A probabilistic approach illuminates where risk is concentrated and what its impact could be, helping fine-tune position aggressiveness and hedging strategies. As uncertainty grows across increasingly weather‑sensitive grids, the ability to measure and intelligently manage tail risk will define the next generation of term trading and capacity planning.


.svg)


%20(3).png)
%20(2).png)
%20(1).png)


.png)


.avif)


.avif)

.avif)


.avif)


.avif)
%20(15).avif)

.avif)
%20(10).avif)

.avif)


.avif)

.avif)


.avif)


