

Every power trading desk has the same blind spot. Your short-term models give you a solid read through day 14, but beyond that, you're relying on ECMWF ensembles, internal meteorologists, seasonal averages, or gut feel.
By the time a developing weather event enters your 14-day window, the entire market sees it simultaneously. The trade is already crowded. The edge is gone.
We built Amperon's seasonal Mid-Term Forecast (MTF) to close that gap. The MTF uses Amperon’s ML-based load forecasting capabilities and ECMWF’s sub-seasonal (“EC-46”) and seasonal (“Seasonal 7 mo”) forecasts to extend demand visibility from day 14 out with a probabilistic, load-specific signal calibrated against 60,000+ backtest examples.
The signal analysis we published internally showed the MTF retains real forecast skill during active weather: 16–32% error reduction versus a 5-year climatology baseline at 14–30 day lead times, with directional accuracy of 66–77% during extreme temperature events.
The signal analysis we published internally showed the MTF retains real forecast skill during active weather.
But skill scores don't pay for futures positions. So we asked the obvious next question.
How to Trade on a Mid-Term Forecast
We connected the MTF signal to ICE power futures across five major hubs — PJM Western Hub, ISO-NE Mass Hub, CAISO NP-15, ERCOT North 345KV, and MISO Indiana Hub — and ran a fully mechanical backtest over the Winter 2026 evaluation period (October 2025 through March 2026).
Here’s what we found:
- Monthly futures strategy: When the MTF P50 for a delivery month indicates peak load will exceed the 5-year climatological normal by more than 5% at a 14–21 day lead time, go LONG the monthly peak future. When more than 5% below normal, go SHORT. Entry at the settlement price on the signal date. Exit at the last available settlement before delivery.
- Daily futures strategy: When the MTF P50 flags a specific day's peak load as more than 10% above climatology at 14–21 day lead time, go LONG the daily peak future for that delivery date. Entry and exit at settlement prices.
These are real ICE contracts with real settlement prices. The only question: if you had the MTF signal, what would you have made?
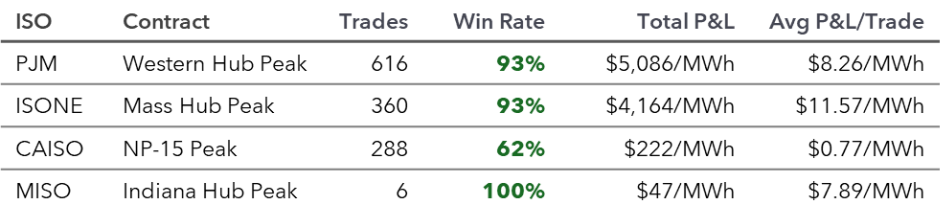
Monthly Futures: 86% Win Rate to Settlement
Across 1,270 signal-triggered trades on monthly peak futures, the above strategy won 86% of the time (1,091 profitable trades) with an average profit of $7.50/MWh per trade and $9,520/MWh in cumulative P&L.
The above strategy won 86% of the time (1,091 profitable trades) with an average profit of $7.50/MWh per trade.
The eastern markets dominated. PJM Western Hub Peak ran 616 trades at a 93% win rate, averaging $8.26/MWh per trade. ISO-NE Mass Hub Peak showed the same 93% win rate across 360 trades, averaging $11.57/MWh. These are the deepest, most liquid power markets in the country, and the MTF signal translated directly into profitable futures positions at 14–21 day lead times.
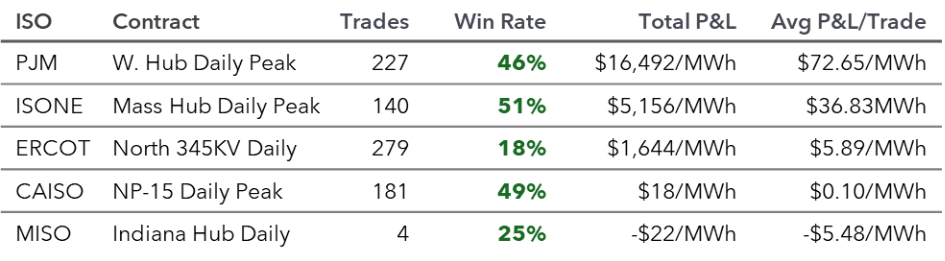
Daily Futures: Where the Real Money Is
Daily peak futures are more volatile, less liquid, and settle against the actual day-ahead price. The win rates are lower (46% in PJM, 51% in ISO-NE, 18% in ERCOT), but the payoff asymmetry is massive.
When the signal catches a real weather event, the daily future can settle at 5–10x entry. The losses on quiet days are $20–60/MWh. The wins on event days run $200–560/MWh. Total daily P&L across 831 trades: $23,288/MWh cumulative.
The losses on quiet days are $20–60/MWh. The wins on event days run $200–560/MWh.
PJM daily peak averaged $72.65/MWh per trade across 227 trades. ISO-NE Mass Hub daily averaged $36.83/MWh across 140 trades. You don't need to be right on every signal. You need to be right on the days that move.
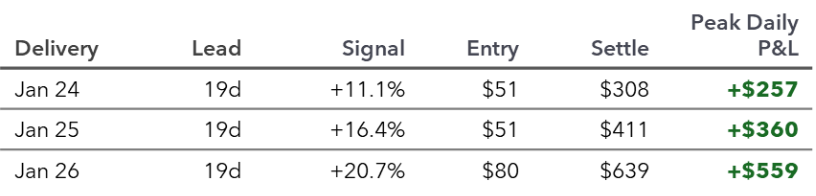
Anatomy of the Signal: The January 2026 Cold Snap
The January 24–27 cold snap was the defining event of the winter. PJM peak daily prices spiked from roughly $80–90/MWh to $308–$639/MWh. The MTF saw it coming nearly three weeks in advance.
On January 5 and 6, the MTF flagged January 24–26 as +11% to +21% above climatology. At that point, daily peak futures were trading at $51–$84/MWh — near-normal levels. The market hadn't priced in the cold snap yet.
The best single trade: entry at $79.85/MWh on January 6, with the signal showing +20.7% above climatology at a 19-day lead. Settlement on January 26: $638.73/MWh. That's +$559/MWh on a single contract from a mechanical signal.
The MTF didn't just predict the direction. It identified the event 2–3 weeks before the futures market priced it in. That gap between signal and market repricing is the edge.
The MTF didn't just predict the direction. It identified the event 2–3 weeks before the futures market priced it in.
What These Numbers Do and Don't Prove
This is a signal backtest, not a strategy backtest. It proves the MTF signal contains tradeable information at 14–21 day horizons. It does not simulate a production trading system. Every trade is 1 MWh — no position sizing based on signal strength or conviction. Entry prices are settlement prices, not executable fills. Multiple vintages flagging the same event are counted as separate trades, so the January cold snap generates dozens of entries that a real desk would consolidate into a single position. Transaction costs and margin aren't included.
The MTF signal contains information about future power prices that is not yet reflected in futures markets at 14–21 day lead times. The signal's value is concentrated in weather events, but quiet-weather signals also typically mean less market action. Eastern ISOs show the strongest signal-to-trade translation, consistent with where the MTF's extended-range skill is highest. And the asymmetric payoff structure is real: small, bounded losses when the signal fires on quiet days, outsized gains when it catches a weather event before the market does.
The MTF signal contains information about future power prices that is not yet reflected in futures markets at 14–21 day lead times.
How a Trading Desk Would Use The MTF Signal
A disciplined desk wouldn't trade the signal mechanically. It would use the MTF as one input into a positioning framework:
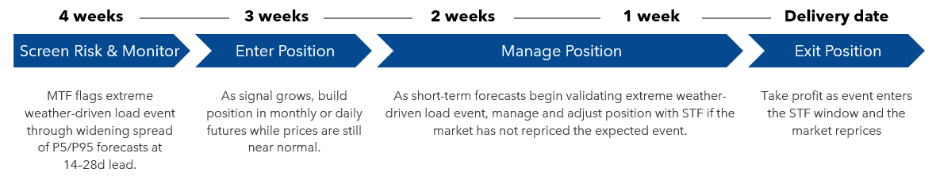
At 14–21 day lead times, the MTF's P90 signal catches 92% of high-load events. About half the warnings materialize as major above-normal demand days. A false alarm costs you a small hedge you unwind. A missed event costs you an unhedged position into a price spike. The asymmetry strongly favors having the signal.
The extended-range signal won't replace your short-term models. It extends your visibility into the window where the next market-moving event is forming but nobody can see it yet. And as this backtest shows, that visibility has real dollar value.
This analysis covers the Winter 2026 evaluation period (October 2025–March 2026) using ICE power futures data. Amperon's MTF provides probabilistic demand forecasts across all major U.S. ISOs. For more on our methodology or to discuss how the MTF fits your desk's workflow, reach out at sales@amperon.co.


.svg)


%20(3).png)
%20(2).png)
%20(1).png)


.png)


.avif)


.avif)

.avif)


.avif)


.avif)
%20(15).avif)

.avif)
%20(10).avif)

.avif)


.avif)

.avif)


.avif)


