Power trading is the buying and selling of electricity, either to manage risk or to profit from price changes. It rarely makes headlines, but it shapes what electricity costs long before power reaches a home or business.
During the July 2026 heat wave, for example, electricity demand on the grid serving much of the US Mid-Atlantic and Midwest hit an all-time record, and contracts for power that week settled at roughly three to five times their mid-May price. If a utility waited to buy power, it paid peak prices, which eventually impacts customers' bills. If it locked in its price well in advance, it was largely protected. Power trading is what made that difference possible.
If a utility waited to buy power, it paid peak prices, which eventually impacts customers' bills. If it locked in its price well in advance, it was largely protected. Power trading is what made that difference possible.
Some power traders are protecting themselves from price swings. Others take on that risk because they expect to earn a profit from it. Together, they keep enough buyers and sellers in the market that someone is always on the other side of a deal, and they help set the day-ahead prices that grid operators use to decide which power plants will run tomorrow.
All of this runs on a daily clock. Each day, traders buy and sell tomorrow's power before a market deadline, usually in the morning, while others manage the electricity flowing today. Because electricity is hard to store, supply and demand have to match every moment, so forecasts of weather, demand, and generation shape nearly every decision.
This guide explains how power trading works in plain language, including what traders buy and sell, who sits on a power trading desk, how a typical day unfolds, and why forecasts matter at each step.
Some power traders are protecting themselves from price swings. Others take on that risk because they expect to earn a profit from it.
What is power trading?
Power trading is the buying and selling of electricity, along with contracts tied to electricity prices. People trade power either to profit from changes in price, which is known as speculating or arbitrage, or to protect themselves against those changes, which is known as hedging. Power trading is sometimes simply called electricity trading.
These trades take place in the wholesale market among power plant owners, utilities, electricity retailers, and financial firms. That's a step removed from the retail market, where you pay your utility or electricity provider a set rate. Power trading is also one part of the broader world of energy trading, which includes natural gas, oil, and other fuels.
Trades take place in the wholesale market among power plant owners, utilities, electricity retailers, and financial firms.
Why is electricity different from other commodities?
Electricity is hard to store in large amounts, so supply has to closely match demand at every moment. Moreover, its price varies widely depending on where and when it's generated and delivered, and on the congestion in between.
Most commodities can sit in a warehouse or a tank until someone needs them, but electricity mostly can't. Batteries are growing quickly, but FERC notes that storage can cover only a portion of what the grid uses, so nearly all power has to be generated at the moment it's consumed. If demand suddenly jumps on a hot afternoon, there's no stockpile to draw from, so the price rises until enough power plants switch on or enough customers cut back.
Most commodities can sit in a warehouse or a tank until someone needs them, but electricity mostly can't... there's no stockpile to draw from, so the price rises until enough power plants switch on or enough customers cut back.
Location matters too. Power lines can only carry so much electricity, so when a line is full, power on one side of it can cost more than power on the other. That combination of timing and location is why power prices move, and why power trading desks are built around tight daily deadlines.
Why do power traders matter?
Power traders keep the market stocked with buyers and sellers, help prices reflect what will happen on the grid, and take on risk that others want to offload. Each of those affects what it costs to keep the lights on.
The first benefit is liquidity, meaning there are enough buyers and sellers to trade with. A utility that wants to lock in next summer's power price needs someone willing to sell at that price, and a wind farm owner that wants to guarantee its income needs a buyer. Traders, including financial firms that own no power plants, fill those gaps.
The first benefit is liquidity.
Traders also make prices more accurate. Most power markets set prices a day ahead and adjust them in real time, and if traders believe tomorrow's day-ahead price is too low given the weather forecast, they buy, which pushes it up. If it looks too high, they sell, which pulls it down.
Traders also make prices more accurate.
The Federal Energy Regulatory Commission (FERC), which oversees wholesale power markets in the US, has said this kind of purely financial trading helps day-ahead and real-time prices line up and adds liquidity and competition. That matters because grid operators use day-ahead prices to decide which power plants to schedule for the next day.
Financial trading helps day-ahead and real-time prices line up and adds liquidity and competition.
The independent market monitor for MISO, which runs the grid for much of the central US, studied a full year of financial trading in that market. On that one grid alone, helpful financial trades produced close to half a billion dollars in value in a single year. Most of that value came from firms that trade without owning power plants.
On one grid alone, helpful financial trades produced close to half a billion dollars in value in a single year.
Not every trade helps; researchers at MIT and FERC have documented cases where traders profited from flaws in market rules, which is one reason regulators police these markets.
What are the main types of power markets?
Companies buy and sell electricity in day-ahead markets, real-time markets, private deals between companies, and futures exchanges. Each one covers a different stretch of time, from years before delivery down to the final minutes.
The two that do the most to shape a trading day are the day-ahead and real-time markets. In a day-ahead market, run by a grid operator or a power exchange, power plants offer electricity for each hour or interval of the next day, buyers bid for what they expect to need, and the auction sets prices and a schedule for the following day.
In a day-ahead market... power plants offer electricity for each hour or interval of the next day, buyers bid for what they expect to need, and the auction sets prices.
The real-time market then handles everything that the plan didn't anticipate, such as demand running higher than expected or a power plant breaking down. Some markets, like Australia's, skip the day-ahead auction and rely on a real-time spot market alongside private contracts.
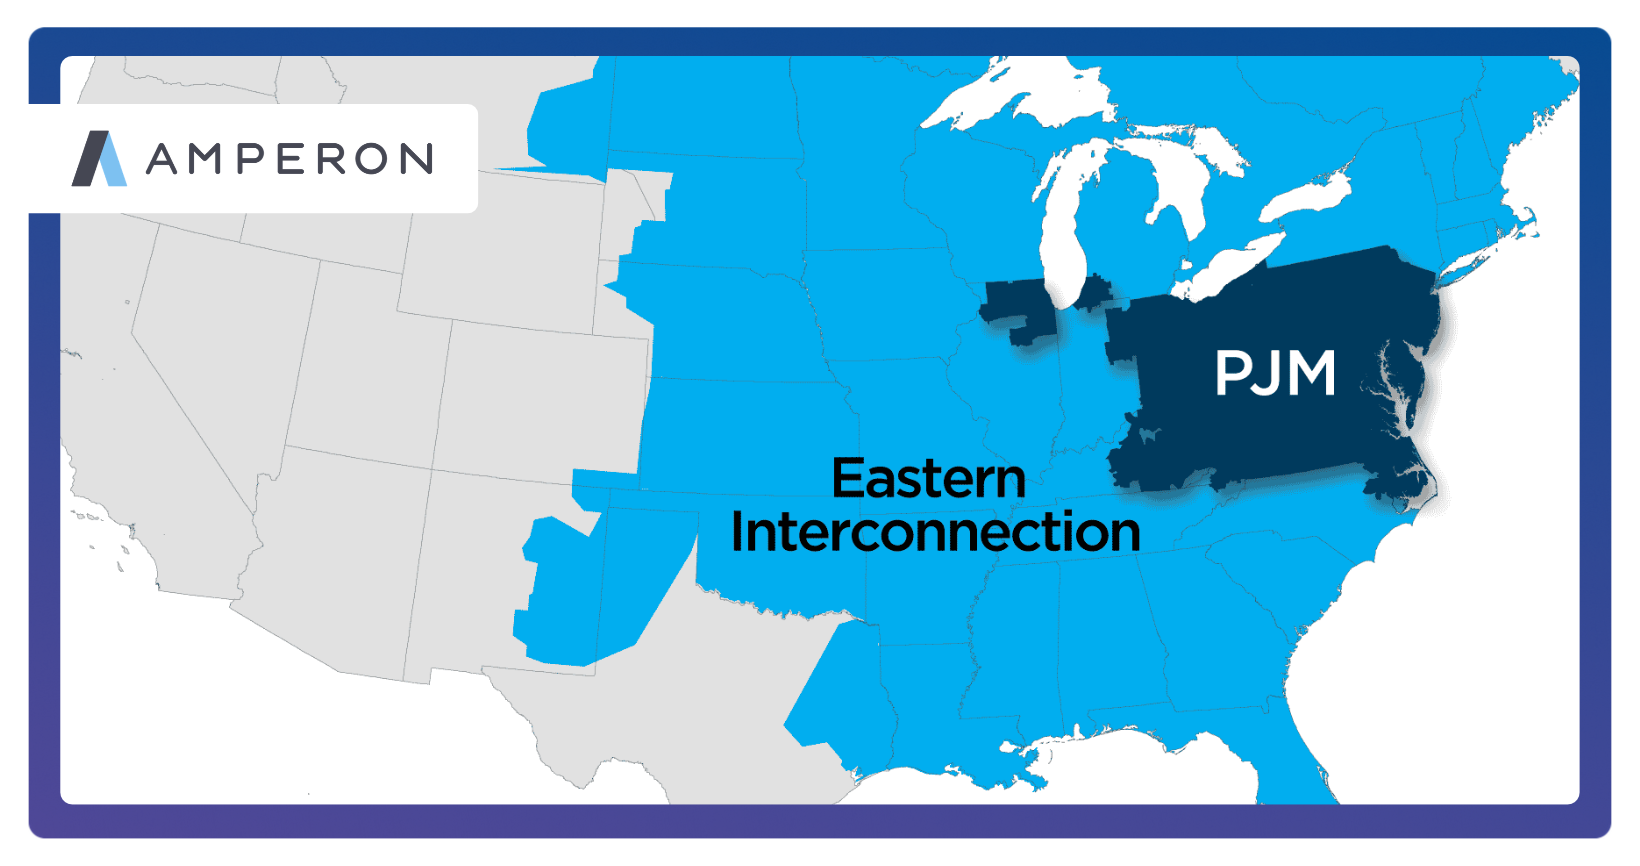
Each grid runs these markets a little differently. For two detailed examples, see our ERCOT Market Guide, which covers Texas, and our PJM Market Guide, which covers the Mid-Atlantic and parts of the Midwest.
What do power traders buy and sell?
Power traders deal in physical electricity, financial contracts tied to its price, and a few specialized products linked to the grid itself.
Who trades power?
Power plant owners, wind and solar owners, utilities and electricity retailers, and financial trading firms account for most power trading.
Power plant owners
Independent power producers and other plant owners sell the electricity they generate and hedge the price they'll receive. A gas plant owner, for example, watches the gap between power prices and fuel costs, because that gap determines whether running the plant makes money.
Independent power producers and other plant owners sell the electricity they generate and hedge the price they'll receive.
Wind and solar owners
Wind and solar asset owners are the fastest-growing group of power market participants. Because their output depends on the weather, they need to know how much they'll produce before deciding how much to sell ahead of time, which makes forecasting important.
Utilities and electricity retailers
Utilities and retailers sit on the other side, buying power for their customers. Their biggest risk is a hot summer or a cold winter that pushes demand and prices above what they planned for, so they lock in prices for much of their expected demand well in advance.
Utilities and retailers sit on the other side, buying power for their customers.
Financial trading firms
Banks, hedge funds, and specialized trading firms often own no power plants and serve no customers. They take positions based on where they expect prices to go, supplying liquidity and taking on price risk that others want to shed.
Banks, hedge funds, and specialized trading firms... take positions based on where they expect prices to go.
Who works on a power trading desk?
A power trading desk is the team that buys and sells electricity for a company. It includes the traders themselves, the analysts who support them, and the staff who schedule, track, and settle every deal.
At smaller companies, one person often covers several of these jobs. A single analyst might handle the weather review, the demand outlook, and scheduling in the same morning.
How does a power trading day run?
A typical day starts with the weather, builds toward a morning deadline for tomorrow's market, and ends with a review of risk and profit. Throughout it all, a separate group manages the power being delivered today. Exact times vary by market, but the rhythm is similar almost everywhere.
Early morning: checking the weather
The major weather models publish new forecast runs several times a day, including overnight, so the first job each morning is to see what changed. A few degrees of extra heat or cold, or a shift in expected wind and cloud cover, can change both how much electricity people will use and how much wind and solar power will be available. Analysts and meteorologists compare the new runs with yesterday's, and load forecasts translate those weather changes into expected electricity use.
The first job each morning is to see what changed.
Mid-morning: forming a view of tomorrow
Next, the desk combines expected demand with everything else that affects price: which power plants are offline for maintenance or repairs, what fuel costs, and where power lines are likely to be crowded. From there, traders estimate what tomorrow's prices should be for each hour and compare those estimates with where the market seems to be heading. Opportunities and risks both show up in the gaps between the two.
Traders estimate what tomorrow's prices should be for each hour and compare those estimates with where the market seems to be heading.
Late morning: submitting day-ahead bids
Day-ahead markets run on firm deadlines. In New York, bids are due by 5am the day before delivery. PJM, which runs the grid across the Mid-Atlantic and parts of the Midwest, closes its auction at 11am and posts results by 1:30pm. In most of Europe, the shared day-ahead auction closes at noon Central European Time. Schedulers submit the desk's final bids, and results typically arrive by early afternoon.
Schedulers submit the desk's final bids, and results typically arrive by early afternoon.
Once the results are in, the desk knows its starting position for tomorrow. Some markets then open a short window for power plants to update their offers before real-time operations take over; in PJM, for example, that window closes at 2:15pm.
All day and night: managing today's power in real time
While one part of the desk plans for tomorrow, another manages the power flowing today, which is known as real-time power trading. Demand runs higher than expected, a power plant trips offline, or the wind dies down, and the plan from the day before no longer matches reality. In US markets, grid operators rebalance supply and demand every few minutes, and any power used or produced beyond what was locked in a day ahead is settled at the real-time price.
Power used or produced beyond what was locked in a day ahead is settled at the real-time price.
Real-time traders respond by adjusting their offers for upcoming hours (in PJM, up to roughly an hour beforehand), striking short-term deals with other companies, and watching the gap between their plan and actual conditions. In Europe, traders can keep buying and selling on intraday markets, now in 15-minute blocks, until shortly before delivery. Because the grid never shuts off, many firms staff their real-time desks in shifts, including nights and weekends.
End of the day: checking risk and results
Before the day shift wraps up, the middle office values every open position at current market prices, confirms the desk is within its risk and credit limits, and reports profit and loss. Traders review what went to plan and what didn't, and those lessons feed into the next morning. Settlement statements from the grid operator arrive in the days and weeks that follow, and the back office checks them line by line against the desk's own records.
Putting it together: a hypothetical heat wave
Suppose the morning forecasts at a utility's power trading desk show a heat wave arriving tomorrow, with demand well above what the desk had planned for. Analysts turn the higher temperatures into a new demand estimate, and day-ahead traders buy more power in tomorrow's auction instead of risking real-time prices during the peak. The next day, real-time traders cover any remaining gap as actual temperatures come in, and the middle office confirms the extra purchases stay within the desk's risk limits.
Beyond tomorrow: term trading
Term traders keep a different clock. Instead of working toward a daily deadline, they buy and sell contracts for future weeks and months, adjusting as longer-range forecasts and prices shift. Historically, term traders relied on historical averages, but weather-informed seasonal forecasting now allows them to foresee actual weather and load events weeks to months in advance.
Term traders keep a different clock. Instead of working toward a daily deadline, they buy and sell contracts for future weeks and months.
What moves power prices?
Power prices rise and fall with demand, the mix of power plants and renewable energy available, outages, crowded power lines, and special pricing rules that apply when supplies run short.
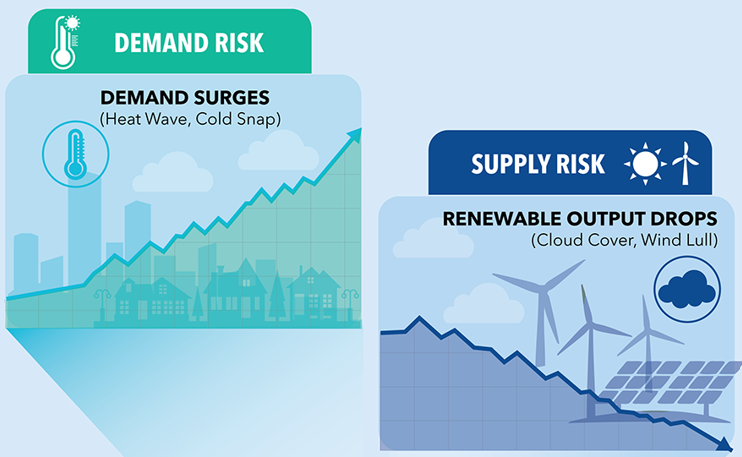
Demand comes first, and weather drives most of its swings, as heat waves and cold snaps push up the need for cooling and heating. New sources of demand are adding to that, especially data centers, which use large amounts of power around the clock. Seasonal climate patterns can tilt the odds as well; an El Niño winter, for example, changes the chances of extreme cold across large parts of the US and beyond.
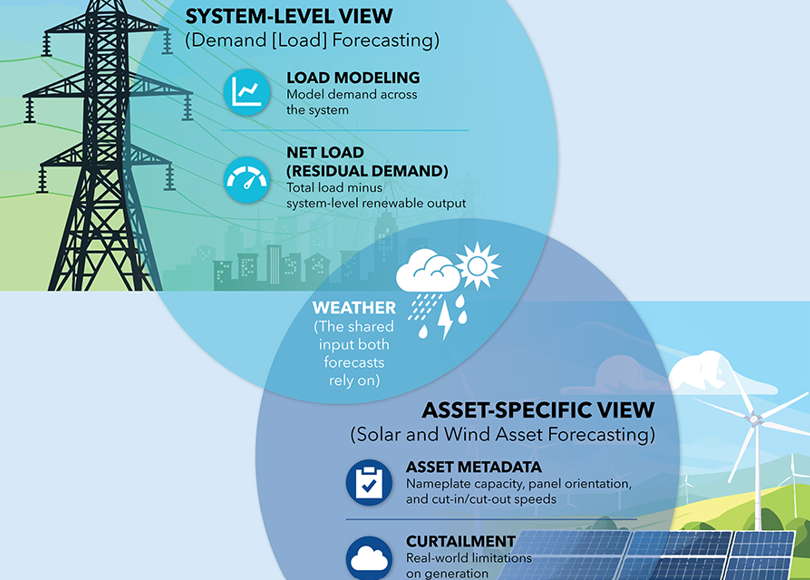
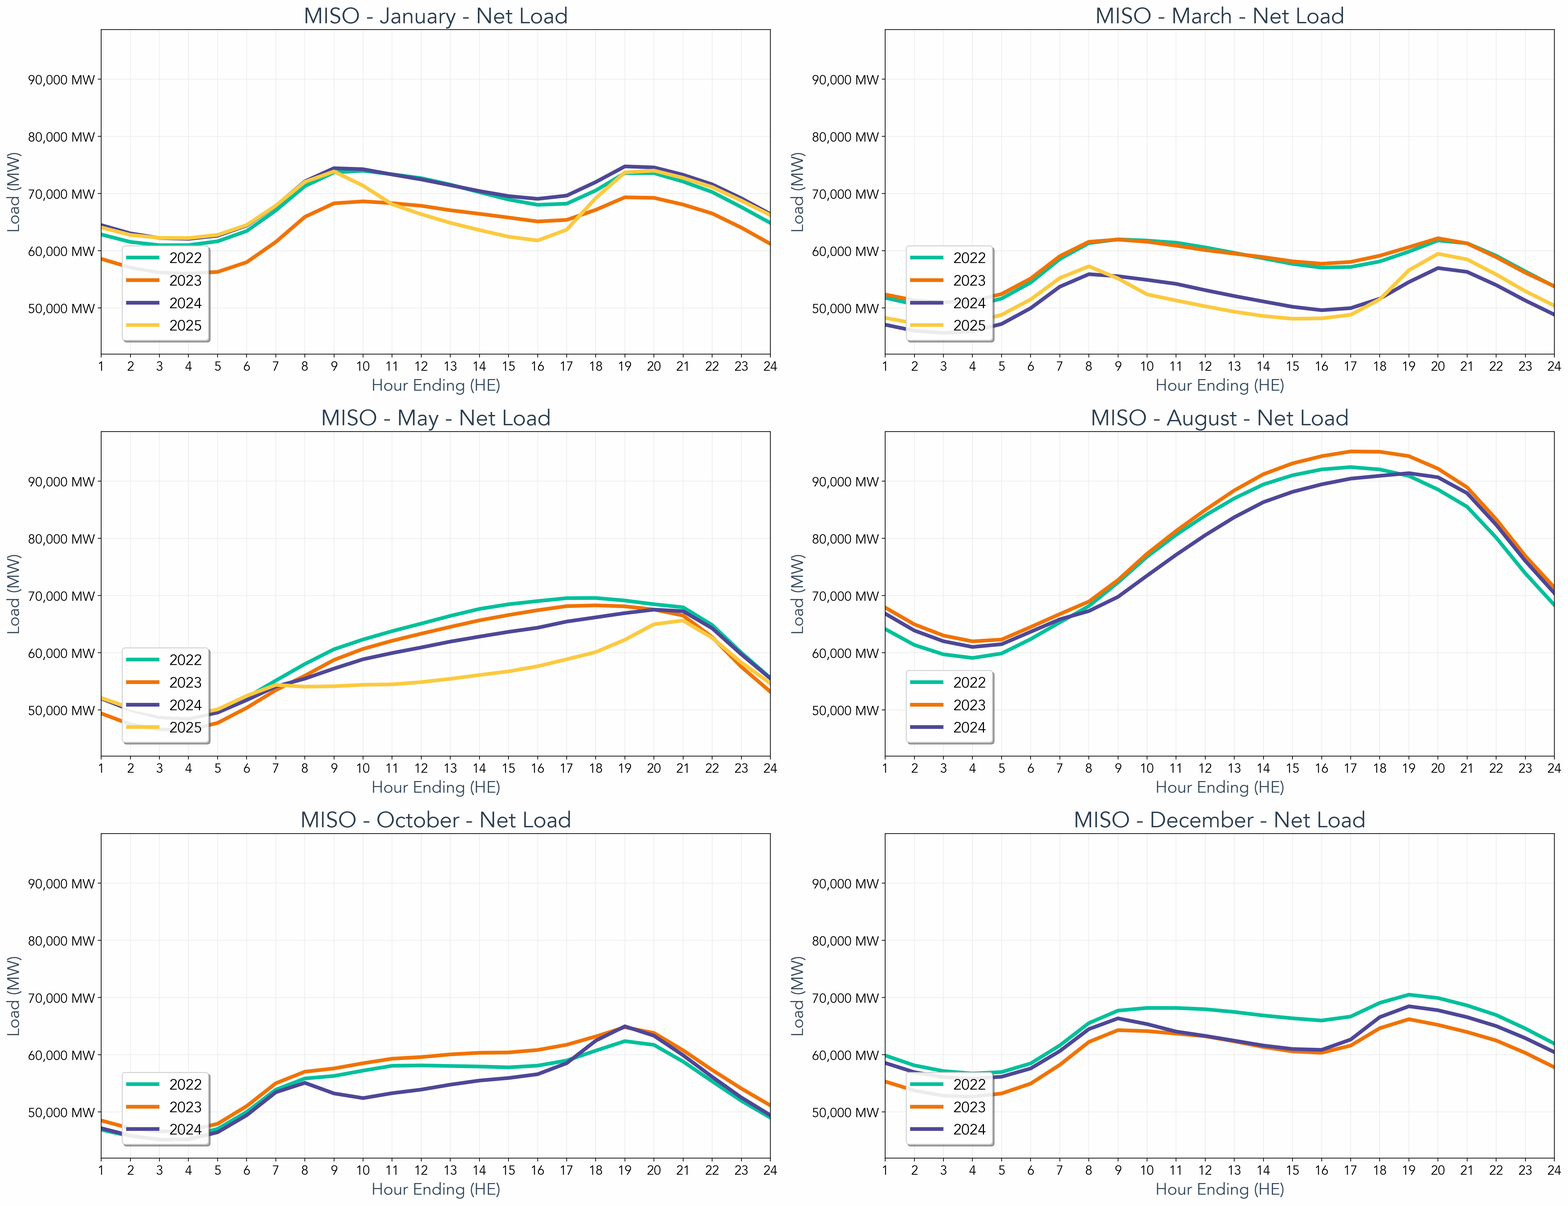
On the supply side, wind and solar have changed what traders watch. Because these sources produce power only when the wind blows or the sun shines, traders pay close attention to net demand or residual demand, which is the demand left over after wind and solar output, as our post on net demand forecasts explains.
Unexpected power plant breakdowns matter as well. During record heat in the eastern US in July 2026, unplanned outages ran well above their usual level for peak summer days.
Crowded power lines can make electricity more expensive on one side of a bottleneck than on the other. And when supplies get tight, many markets apply pricing rules that push prices sharply higher to draw out more supply and encourage customers to use less, which is a big reason wholesale prices in Texas are especially volatile. Price forecasts help traders see which of these factors is driving the outlook on a given day.
Where does forecasting fit on a power trading desk?
Forecasts inform nearly every decision on a power trading desk, from the morning view and day-ahead bids to real-time adjustments and longer-term hedges.
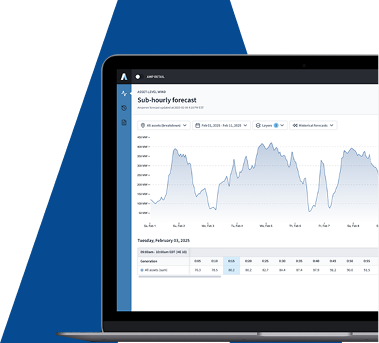
Every step of the trading day depends on a forecast of something: how much electricity people will use, how much wind and solar will produce, and what prices will do as a result. In power trading, timing is a large part of the advantage. The sooner traders can spot a change, the more options they have.
In power trading, timing is a large part of the advantage.
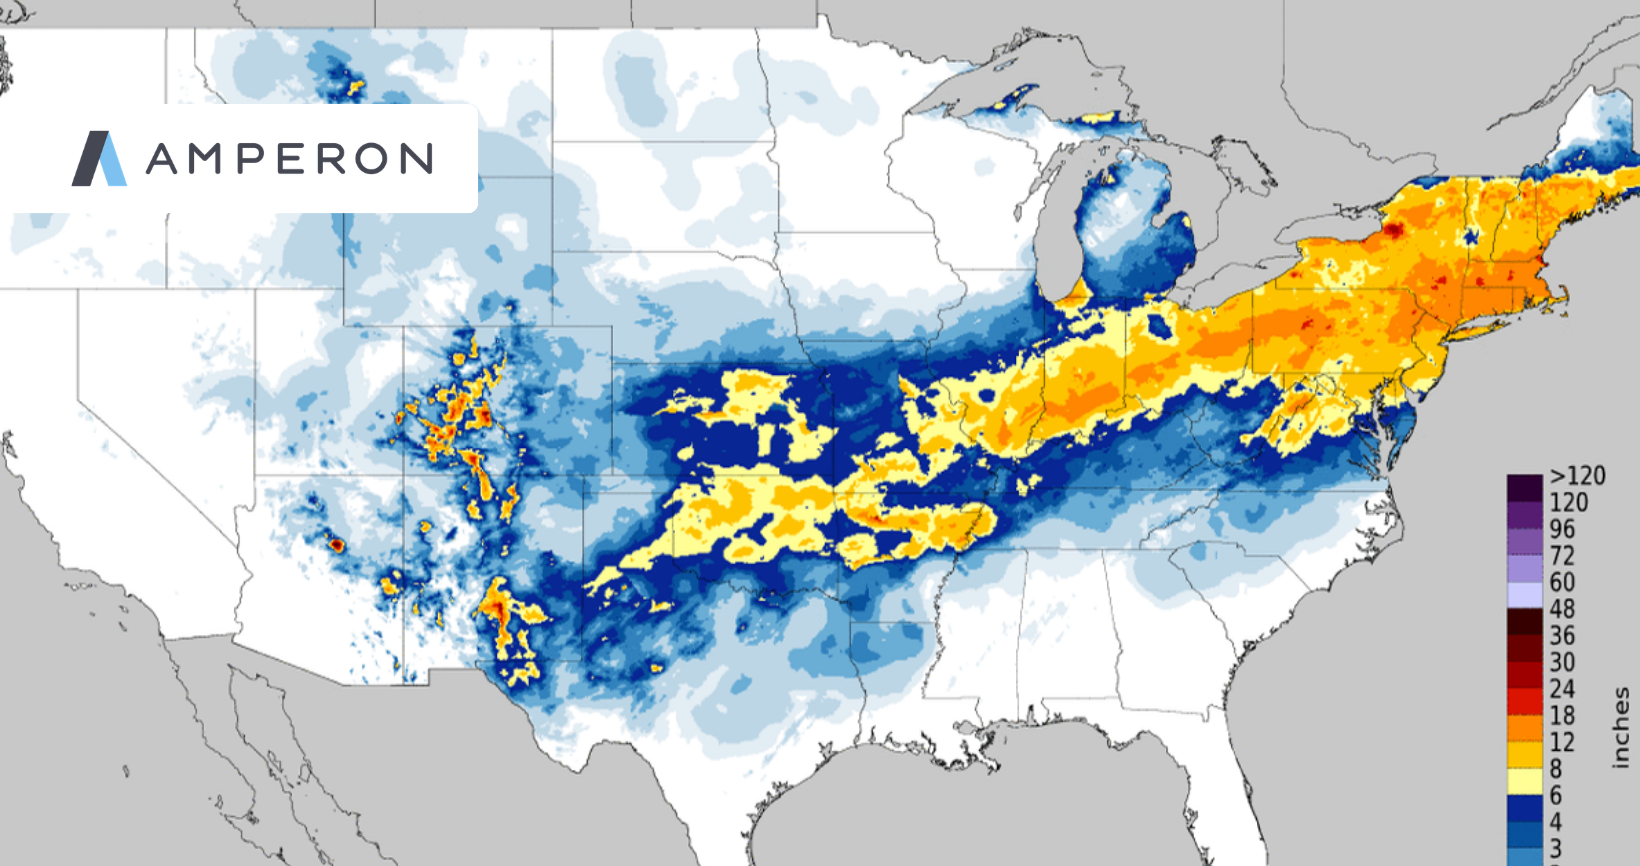
Forecasts that look weeks or months ahead help traders prepare for extreme weather before the rest of the market catches on. Ahead of Winter Storm Fern, Amperon's seasonal demand forecast flagged well-above-normal demand in the eastern US nearly three weeks out, while contracts for those days were still priced near normal levels. In a backtest using actual historical prices, one contract bought on January 6 settled at roughly eight times its purchase price.
The July 2026 heat wave followed a similar pattern. Amperon's seasonal forecast began flagging the risk as early as February and strengthened sharply in mid-May, while contracts for early July were still priced at a fraction of where they settled. A week before the peak, its short-term forecast showed demand approaching record territory.
Good forecasts give a trader's judgment a better starting point and free up time that would otherwise go into turning weather maps into demand estimates.
Power trading terms in plain English
Frequently asked questions
What is power trading?
Power trading is the buying and selling of electricity and contracts tied to its price, either to profit from price changes or to protect against them. Power plant owners, utilities, electricity retailers, and financial firms all take part.
How does power trading work?
Traders form a view of future electricity prices based on weather, demand, power supply, and grid conditions. They then buy or sell in day-ahead auctions, real-time markets, private deals with other companies, or on futures exchanges, and they gain or lose based on how prices actually turn out.
What does a power trader do?
A power trader buys and sells electricity or electricity contracts, either to manage price risk for their company or to profit from price changes. A typical day involves studying forecasts, submitting bids before market deadlines, adjusting positions as conditions change, and staying within the desk's risk limits.
What is a power trading desk?
A power trading desk is the team inside a utility, power producer, bank, or trading firm that buys and sells electricity. It consists of traders, analysts, schedulers, and risk management staff.
What is the difference between power trading and energy trading?
Power trading covers electricity only. Energy trading is a broader category that also includes natural gas, oil, and other fuels, as our Energy Trading 101 guide explains.
What is the difference between day-ahead and real-time markets?
The day-ahead market is an auction held the day before delivery, where buyers and sellers lock in prices for each hour or interval of the next day. The real-time market balances supply and demand as the day unfolds, at prices that reflect actual conditions. The difference between the two prices, called the DART spread, is one of the most closely watched numbers in power trading.
Explore more
Markets and mechanics
- Energy Trading 101: The Commodities, Markets, and Players Explained
- ERCOT Market Guide
- PJM Market Guide
- FTR Trading Strategies in a Changing Grid
- Why Your ETRM Is Only as Good as Its Forecast
Price drivers
- How Weather Impacts Energy Demand & Prices
- Why Wholesale Electricity Prices Are Especially Volatile in Texas
- Data Center Energy Demand: The Top 5 Considerations for Power Traders
- El Niño Winter: Top 3 US Grid Risks in 2026-2027
- Why Your ETRM Is Only as Good as Its Forecast
- How Amperon Performed During the July 2026 Heat Wave
- Behind PJM's 800% Increase in Capacity Prices
Forecasting
- Energy Demand Forecasting: A Beginner's Guide
- Can You Trade on a 3-Week Signal? Here's Proof.
- July 2026 Heat Event: How A Trader Could Have Made +$200 to $400/MWh
- How Amperon Performed During the July 2026 Heat Wave