

Demand in ISO New England (ISONE) is more complicated than ever. Many projections anticipate an 11% surge in electricity demand over the next decade, largely driven by the electrification of heating and transportation. At first glance, this might suggest a straightforward narrative: rising demand equals rising load. But digging deeper, it becomes clear that the seasonal context matters, and the rapid growth of behind-the-meter (BTM) solar is fundamentally changing this equation.
Competing Forces
While electrification is pushing demand upward, the expansion of BTM solar is running in parallel — and sometimes in the opposite direction. Some studies even show that overall demand in ISONE is trending downward, thanks in large part to BTM solar. Over the past 25 years, demand in the region has declined, with BTM solar emerging as a major driver of this trend.
The image below depicts the hourly load for the month of May for the past three years. As you can see, in the past couple of years, we are not seeing consistent year-over-year growth which is due to behind-the-meter solar, energy efficiency programs, and milder weather that have offset what would otherwise be steady increases.
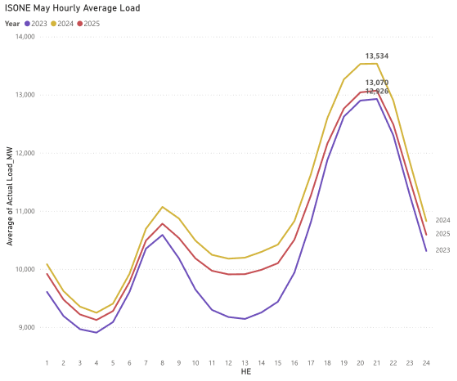
Figure 1: May Hourly Average Load by Year, 2018–2025. This chart shows the evolving daily load shape in ISO-NE, with recent years reflecting a midday dip likely influenced by behind-the-meter solar and energy efficiency gains. (Source: Amperon)
The Evolving Demand Landscape
This shifting balance between rising gross demand and declining grid load is especially evident in ISONE’s long-term forecasts. According to ISONE’s official site, New England’s annual demand is expected to rise from 117,262 GWh to 130,665 GWh by 2034 (ISONE). While this suggests rising consumption driven by electrification, it does not necessarily translate to a proportional rise in grid load. Behind-the-meter photovoltaic systems are expected to offset a significant portion of that demand, displacing 5,555 GWh in 2025 and more than doubling to 11,487 GWh by 2034 (ISONE).
This dynamic means that while gross demand may appear neutral or even declining, the situation is complicated by shifting peak hours. In recent years, ISONE’s peak demand hour has moved later in the day, from the traditional 3:00–5:00 p.m. window to as late as 7:00 or 8:00 p.m. — a clear result of BTM solar’s influence.
On sunny days, BTM solar suppresses peak demand until later in the evening, but on cloudy days, reduced solar output can cause peak demand to occur earlier or spike unexpectedly. The figure below compares hourly load on two consecutive days — one sunny, one cloudy — in June 2025. The dark blue line depicts demand, and the orange line depicts solar generation. On the sunny 27th, BTM solar significantly reduces midday load, creating a steep "duck curve." On the 28th, with less solar irradiance, the curve is flatter and the peak occurs earlier.
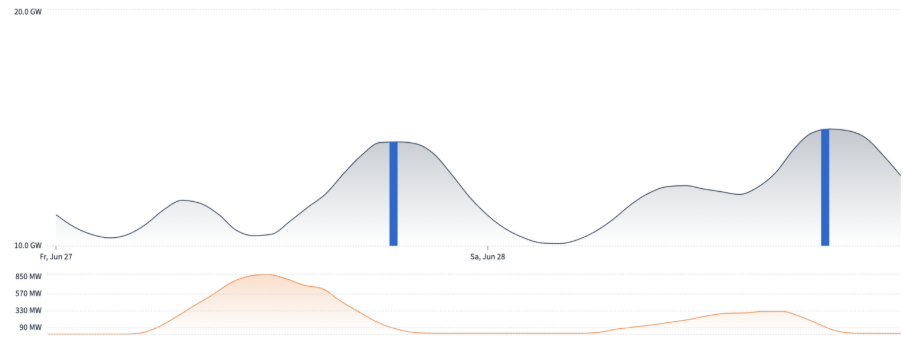
Figure 2: Hourly Load Profiles on Sunny vs. Cloudy Days. This graph compares daily demand curves, in comparison to the amount of sunlight for each given day, underscoring how BTM solar shifts and flattens the peak during sunny conditions, while cloudy weather leads to higher, earlier peaks. (Source: Amperon)
Winter: The New Peak Season?
While summer peaks have historically been the focal point for ISONE’s system planning, this is rapidly shifting. As BTM solar reduces grid demand during summer afternoons, winter is emerging as the new stress point for the regional grid. Electrification of heating is driving winter load growth, and BTM solar contributes far less during these months due to shorter daylight hours and early sunsets. This means ISONE may face higher net loads, and therefore higher prices during cold evenings, when solar output is zero and heating demand is peaking. As a result, winter reliability and capacity planning are becoming increasingly important for market operators and stakeholders alike.
Operational Challenges and Market Volatility
The interplay between electrification, BTM solar, and shifting seasonal dynamics is fundamentally reshaping ISONE’s energy landscape. Electrification is driving overall demand higher — especially during the winter months as more homes and businesses switch to electric heating. At the same time, BTM solar continues to flatten summer peaks and shift load curves, leading to unexpected changes in when and how demand materializes. The result is a more volatile and less predictable grid, where net demand is increasingly influenced by the variability of solar output, weather patterns, and time of year rather than traditional consumption trends.
As these forces continue to evolve, accurate forecasting becomes more essential. That’s where energy forecasting platforms like Amperon offer critical value — providing the precision and responsiveness needed to navigate a grid that is no longer defined by averages, but by variability.


.svg)


%20(3).png)
%20(2).png)
%20(1).png)


.png)


.avif)


.avif)

.avif)


.avif)


.avif)
%20(15).avif)

.avif)
%20(10).avif)

.avif)


.avif)

.avif)


.avif)


