Energy demand forecasting sits at the very center of the energy transition. Forecasting has long helped grid operators, load-serving entities, and customers plan for the future, both near-term and long-term. Today, as grids are changing faster than ever, forecasting has taken on an increasingly important role for all types of power market participants.
Energy demand forecasting sits at the very center of the energy transition.
Energy demand forecasting is the practice of predicting how much electricity will be consumed across a grid, a utility’s service territory, or a retail energy provider’s book of business over a defined future period. Forecasts range from five minutes to five or more years out.
Nearly every operational and financial decision in wholesale power starts with forecasting: what to generate, what to bid, what to hedge, what to build. This page covers what demand forecasts are, how they are produced, what moves them, and how to tell a good one from a bad one.
Load, net load, and peak demand: the terms that matter
Demand or load is the electricity being drawn, or expected to be drawn, from the system at a given instant, measured in megawatts (MW). In power markets, load and demand are used interchangeably, and both refer to gross demand (total consumption, before accounting for any distributed energy generation that offsets it).
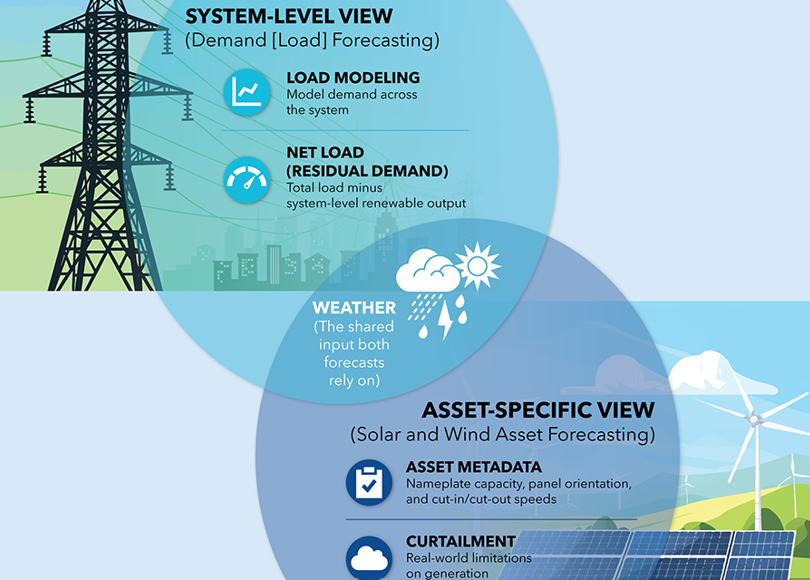
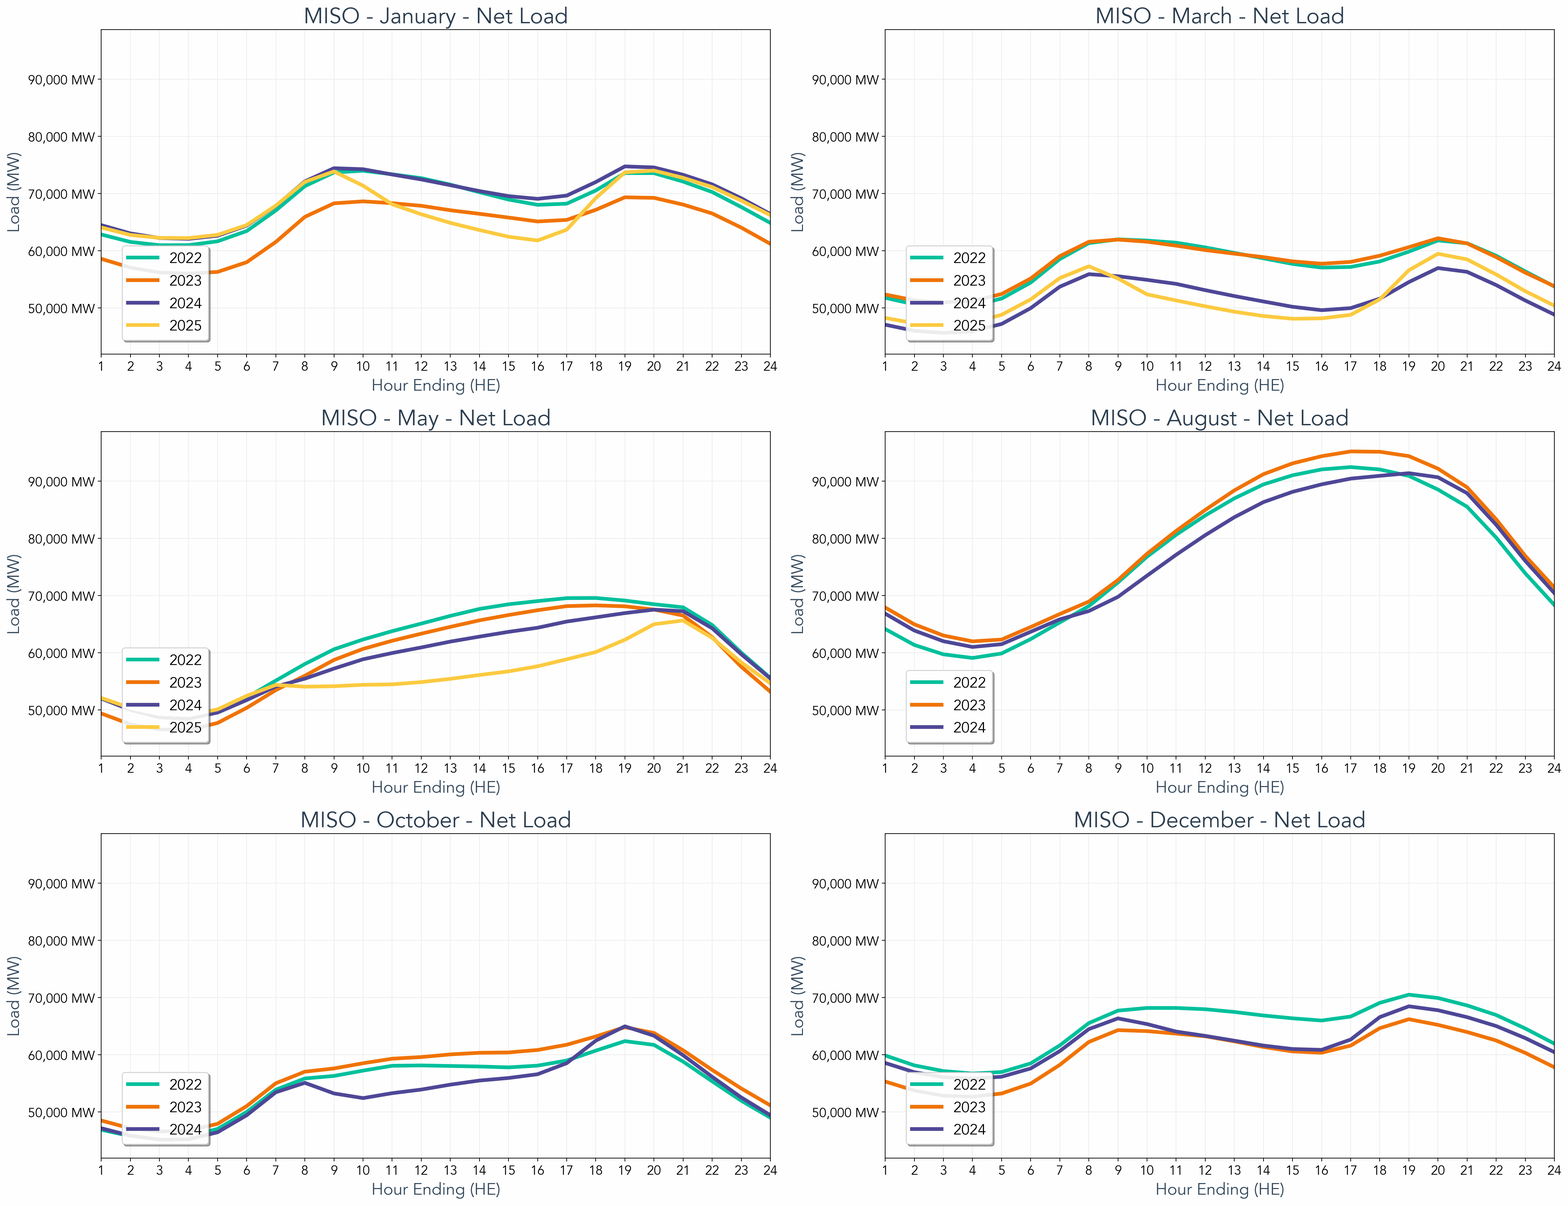
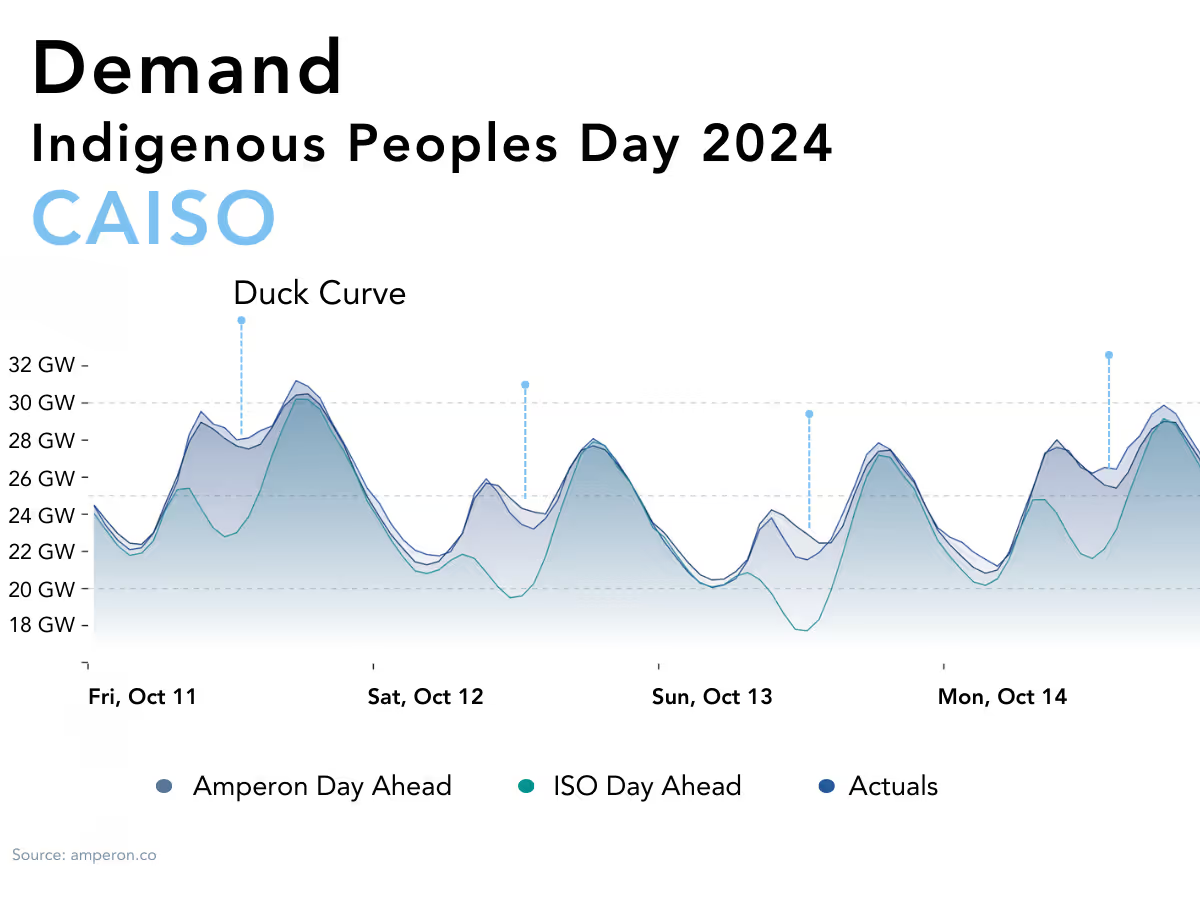
Net demand, net load, or residual demand is total demand minus generation from non-dispatchable energy resources like solar and wind. It is the quantity that dispatchable resources like coal, gas, and nuclear generation actually have to serve, and it is the number that sets price in most hours. As renewable penetration rises, total demand and net demand can diverge significantly.
As renewable penetration rises, net demand and gross demand can diverge significantly.
Peak demand is a system’s highest demand within a given measurement period, such as a month or a year.
Coincident peak is a specific customer's demand at the moment the wider system peaks, which is the basis for transmission cost allocation in ERCOT, PJM, MISO, and others.
Forecast horizons and what each is for
Horizon determines the data available, the modeling approach, and the achievable accuracy. A forecast built for one horizon rarely transfers to another. Even where there is overlap, users are advised to focus on a forecast that matches their primary planning window.
A forecast built for one horizon rarely transfers to another.
Accuracy degrades with distance, but not uniformly. A mid-term forecast can be useful for planning even if its two-week window is less accurate than in a short-term forecast, because the signal that matters at that range is the magnitude and rough timing of a future weather or load event.
What drives electricity demand
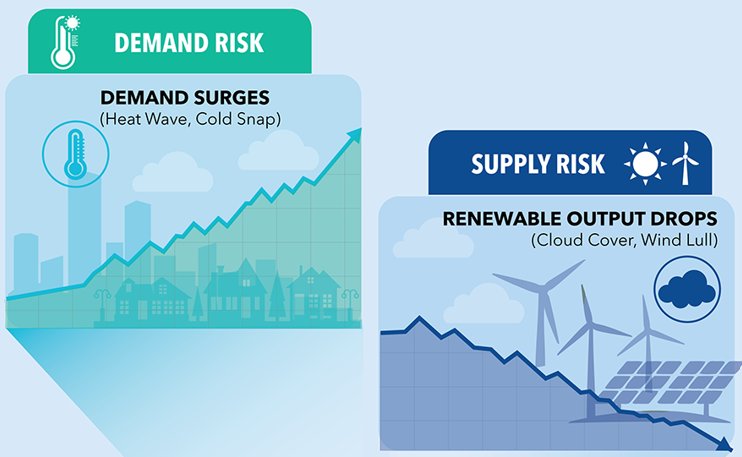
Weather dominates. Temperature alone explains most of the variance in short-term load, and the relationship is nonlinear: the marginal load added by each degree below 20°F is generally much larger than the load change between 74°F and 75°F. But temperature is not the whole picture:
- Humidity, dew point, wind chill, and cloud cover, which change how a given temperature translates into cooling and heating load (and how solar and wind output will reduce net load)
- Calendar effects: day of week, public holidays, daylight saving transitions, school schedules, and one-off events like a championship game
- Behind-the-meter solar, which suppresses midday metered load and shifts the net peak into the evening
- Electrification of heating and transport, which is steepening winter morning ramps in some regions and changing the shape of the annual peak
- Structural load growth from data centers and industrial activity, which can add large, flat, weather-insensitive blocks to the base
- Price response and demand-side programs, which cut the top off peaks in ways that are difficult to predict and observe
The last two are why historical load data alone is a weakening predictor. A model trained on five years of a service territory's history will under-forecast a region that has since added two gigawatts of data center load.
A model trained on five years of a service territory's history will under-forecast a region that has since added two gigawatts of data center load.
How energy demand forecasts are built
Data inputs
An electricity demand forecast typically combines weather predictions from models such as ECMWF; load data from grid operators, government sources, or directly from smart meters and telemetry; calendar and event data; and more. Net demand forecasts also include renewable energy generation data.
Weather data granularity matters more than most buyers expect. A forecast keyed to a single airport station for an entire zone will miss the spatial variation that determines where load actually shows up.
Weather data granularity matters more than most buyers expect.
Modeling approaches
Statistical and physics-based forecasting models map weather and calendar variables to load using relationships that are transparent and stable. They behave predictably in conditions the model has seen before, and they can account for specific asset-level parameters.
Machine learning models such as boosted trees and neural networks capture nonlinear interactions that regression models can miss, particularly when grid dynamics are changing rapidly.
Hybrid approaches run both types of models and dynamically blend them. In practice, this tends to outperform either approach alone: the statistical component keeps the forecast anchored during normal conditions, and the ML component handles the nonlinearities that matter most during extreme events.
The statistical component keeps the forecast anchored during normal conditions, and the ML component handles the nonlinearities that matter most during extreme events.
Deterministic and probabilistic forecasts
A deterministic forecast gives one number per interval, or a range of potential outcomes organized by quantiles. These bands break a forecast into various buckets, but they don’t tell you which outcome is most likely.
A probabilistic forecast gives a distribution coded by the probability of each potential outcome. Users can expect actual load to fall below the P50 prediction half the time, and to fall below the P90 prediction 90% of the time. For any activity dealing with substantial risk (capacity procurement, position sizing, hedging, tail exposure), a probabilistic distribution is the more useful output.
A probabilistic forecast gives a distribution coded by the probability of each potential outcome.
Ensemble methods produce these distributions by running many weather scenarios through the load model, which also reveals how much of the forecast uncertainty is weather uncertainty versus model uncertainty.
Can AI be used for energy forecasting?
Yes, and it is already standard practice. Machine learning models have been used for load forecasting for over a decade, and AI-based weather prediction (models trained on historical reanalysis data rather than solving physics equations directly) is now being integrated into operational forecasting workflows as well.
Machine learning models have been used for load forecasting for over a decade, and AI-based weather prediction is now being integrated as well.
Two caveats. First, large language models are not load forecasters; they are useful for summarizing market context and parsing unstructured data, not for predicting megawatts. Second, most forecast error traces back to the weather inputs, not to model architecture.
How to measure forecast accuracy
Vendors report accuracy differently, which makes comparison harder than it should be. The metric choice is not neutral: it determines which errors are visible.
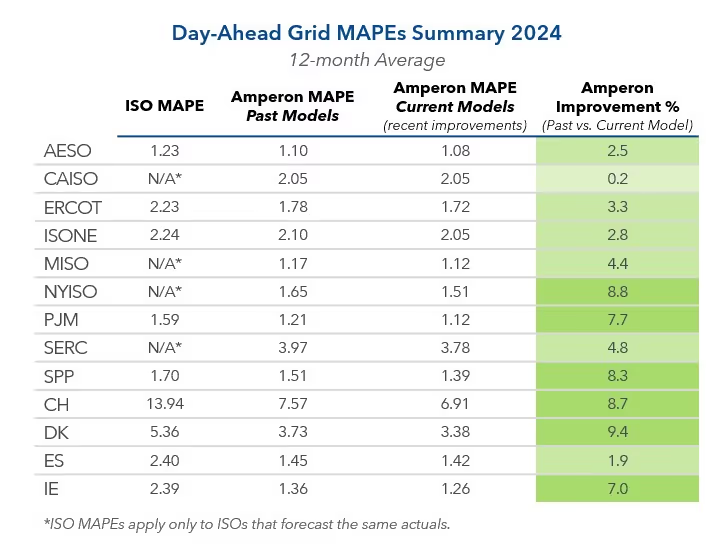
Two practical rules. First, MAPE is the wrong metric for anything whose value can approach zero, such as solar and wind generation; use nMAE for load and cnMAE for renewable assets. Second, a single site-wide or annual accuracy figure will hide the hours you actually care about. Ask for error during peak hours, during the top ten load days of the year, and during named extreme events.
What software can I use to forecast energy demand?
The options fall into three groups. In-house models built on internal load history and a purchased weather feed, which give full control and require a data science team to maintain. General-purpose forecasting or supply chain demand planning platforms, which are built for inventory and do not handle weather-driven, sub-hourly, grid-referenced load. And specialized energy forecasting platforms, which provide load, net demand, price, and renewable generation forecasts referenced to specific ISOs, zones, nodes, and meters.
If you are evaluating the third category, the questions that separate vendors are: which markets and granularities are covered, which horizons are offered and whether they are modeled separately, whether forecasts are probabilistic, how weather data is sourced and at what resolution, how accuracy is reported and whether backtests are available for your own load, and how the forecast is delivered (API, data warehouse share, or user interface).
The questions that separate vendors are: which markets and granularities are covered, which horizons are offered and whether they are modeled separately, whether forecasts are probabilistic, how weather data is sourced and at what resolution, how accuracy is reported and whether backtests are available for your own load, and how the forecast is delivered.
Amperon forecasts load, net demand, coincident peak, price, and renewable generation across more than 25 grids in North America and Europe, from sub-hourly to long-term horizons, delivered via API, Snowflake, and the Amperon platform.
Who uses energy demand forecasting
- Utilities (including IOUs, munis, and coops): procurement, load risk management, maintenance planning, integrated resource planning
- Retail electricity providers: portfolio hedging, customer load shape management, margin protection, slice-of-system forecasting
- Power traders: position sizing, hedging, term trading, tail risk management
- IPPs: generation forecasting, scheduling, intraday trading, imbalance charge management, ancillary services market participation
- Grid operators: unit commitment, reserve procurement, reliability
- Commercial and industrial energy buyers: energy budgeting, contracting, demand management, coincident peak avoidance
Frequently asked questions
What is load forecasting?
Load forecasting is the prediction of electricity consumption over a future period, expressed in megawatts at a defined interval and geography. It is the same activity as energy demand forecasting; "load" is the term more common among utilities and grid operators, "demand" more common in commercial and market contexts.
How far in advance can electricity demand be accurately predicted?
Useful skill extends well past the day-ahead window. Sub-hourly and day-ahead forecasts are accurate enough to trade and dispatch against. Two-to-four-week forecasts can reliably signal the magnitude and approximate timing of major temperature events, which is enough to position a term book. Beyond a season, forecasts become scenario exercises rather than predictions, and should be consumed as distributions.
What is the difference between energy demand forecasting and supply chain demand forecasting?
They share a name and almost nothing else. Supply chain demand forecasting predicts unit sales over days to months, driven by price, promotion, and seasonality. Energy demand forecasting predicts instantaneous power draw at five-minute to hourly resolution, driven overwhelmingly by weather, and must balance in real time because electricity cannot be inventoried.
Further Reading
Energy forecasting methods and models
- Why a hybrid regression/ML approach outperforms in energy forecasting
- The Evolution of Energy Forecasting: From Deterministic to Probabilistic
- Quantifying Solar and Wind Uncertainty with Probabilistic Forecasting
- Amperon's methodologies: AI-powered forecasting for the energy transition
- The Double-Edged Sword: Using LLMs in Electricity Market Forecasting
- Always Innovating: Amperon's New Techniques to Improve Energy Forecasting
- Seasonal Change Brings Forecasting Problems—Unless Your Model is Built for It
- Introducing Amperon's Ensemble Forecast, NBM Integration, and Advanced Weather Package
Energy forecasting data inputs
- Inside our Data: The Importance of Granular Weather Data
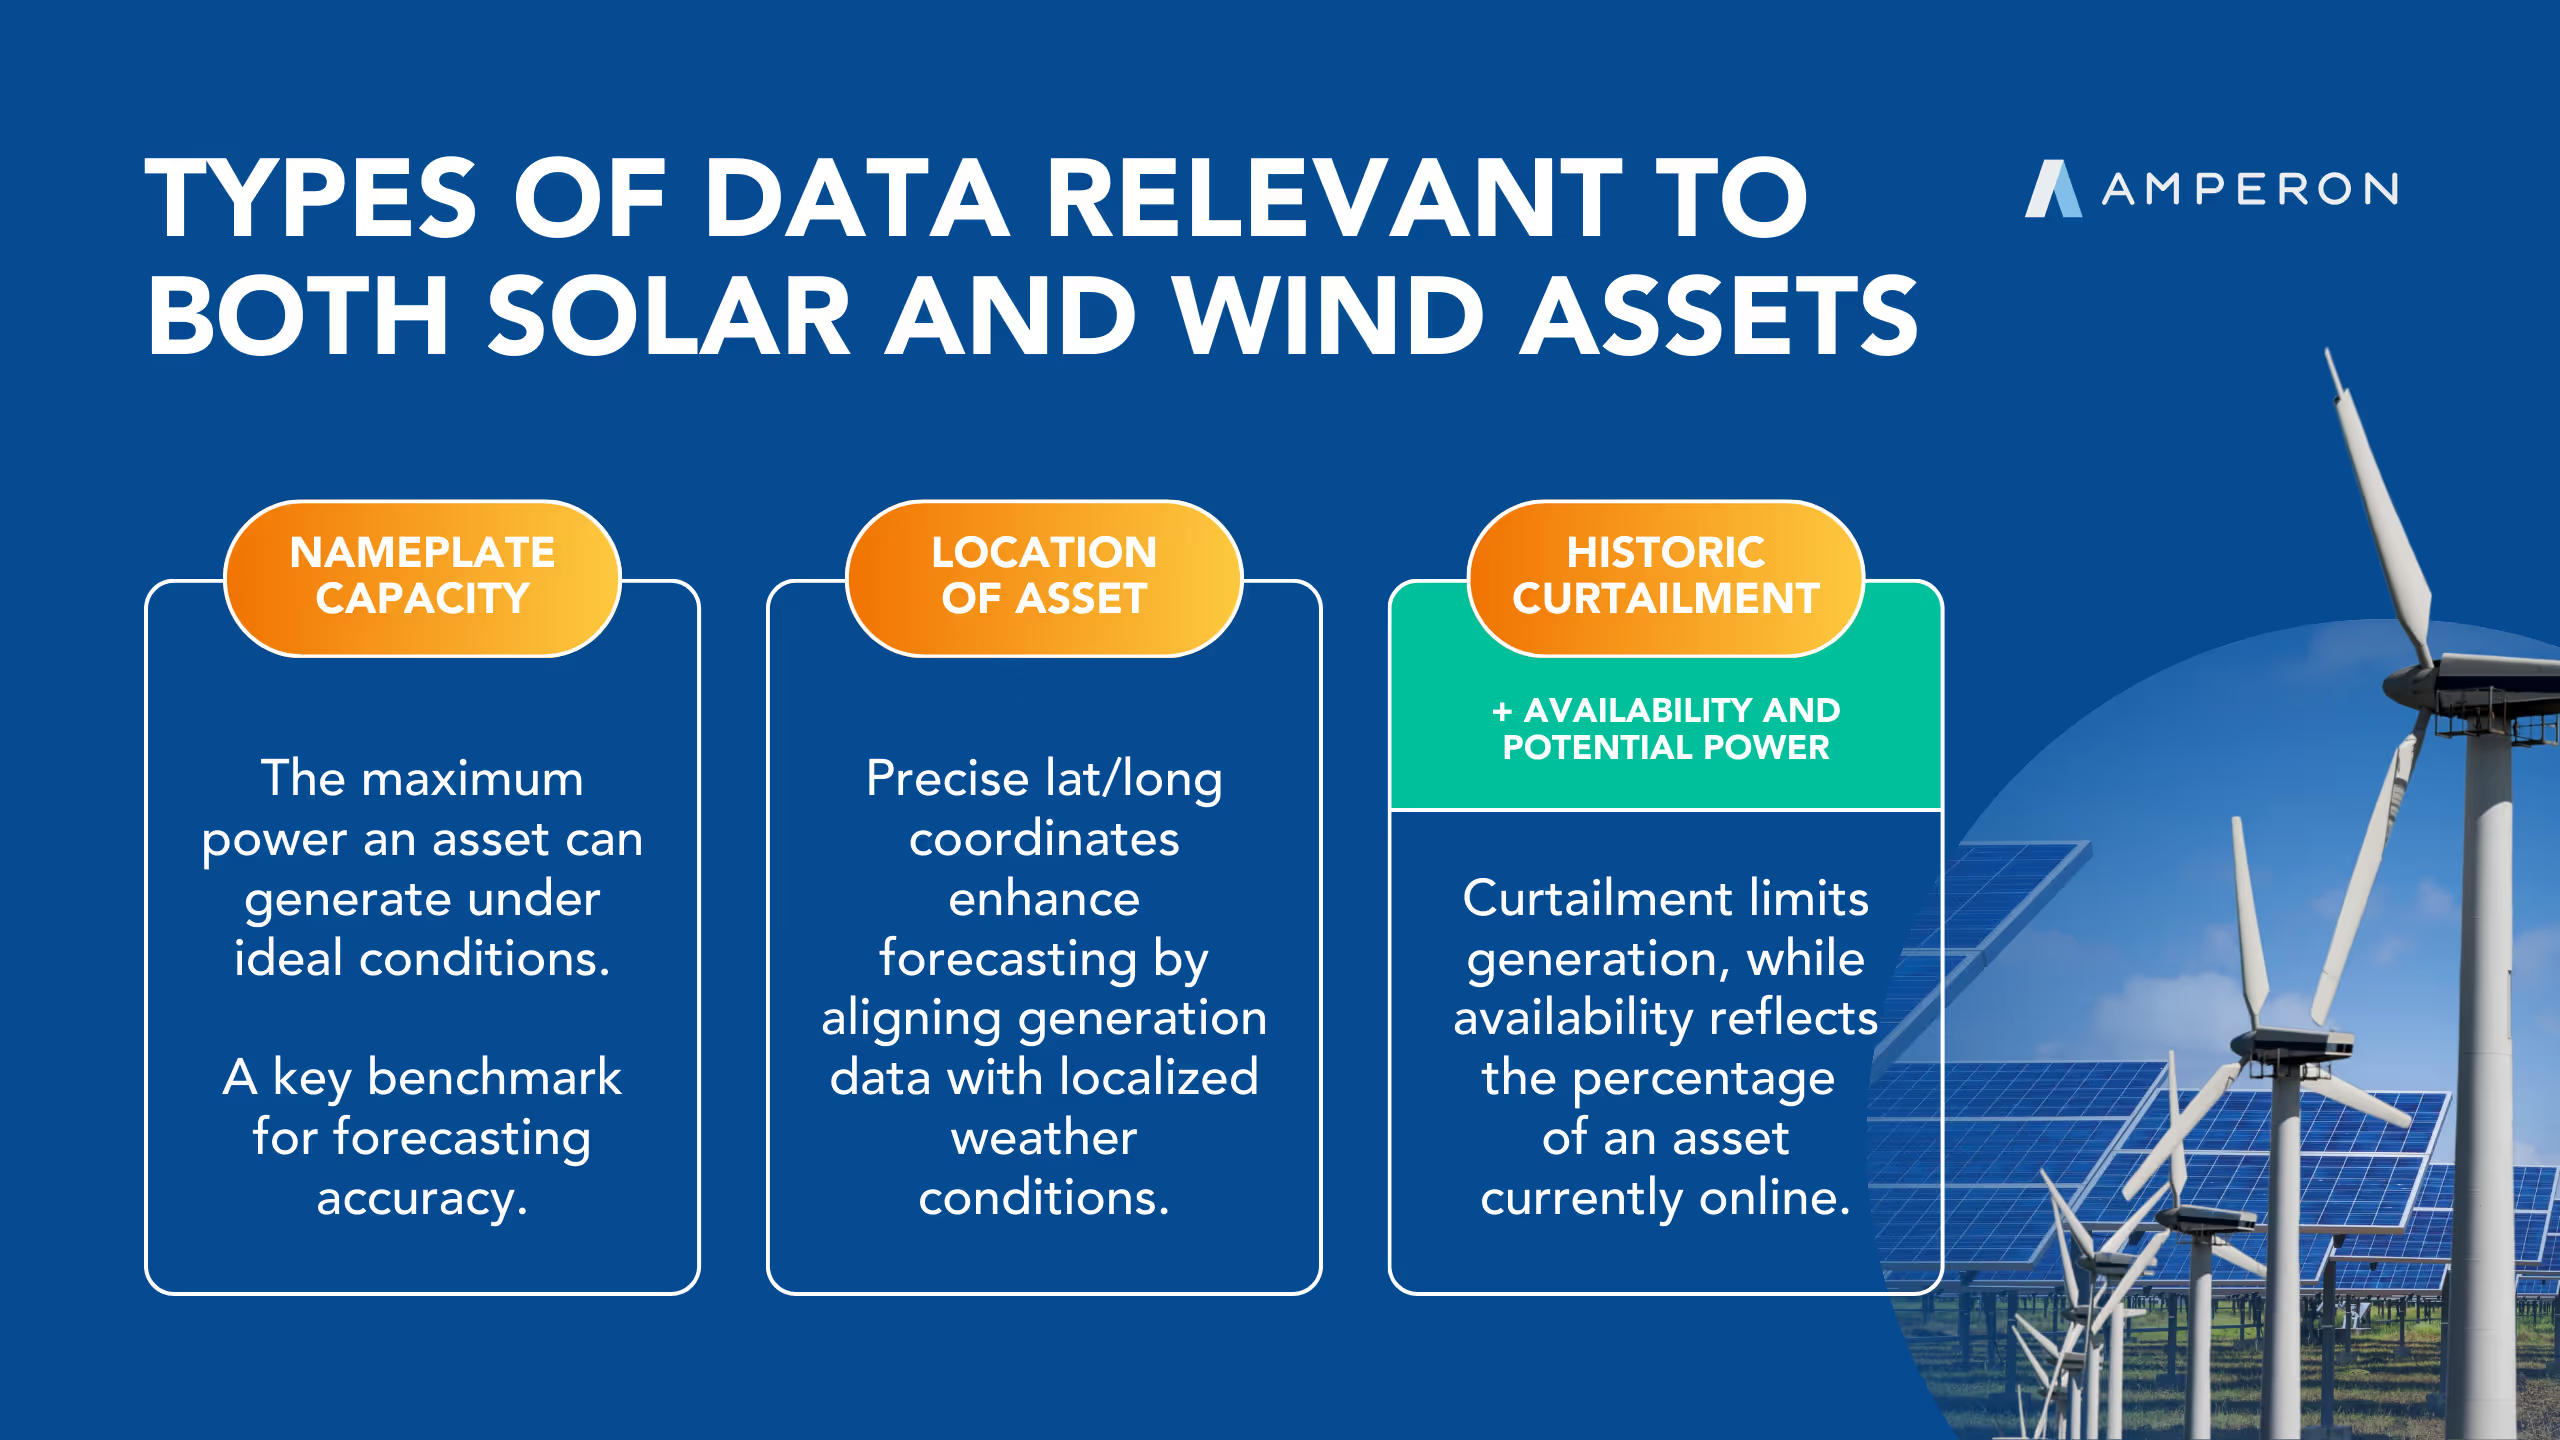
- Inside our Data: Intro to Renewable Asset Data
- Amperon Integrates AI Weather Forecasting from ECMWF
- How weather impacts energy demand & prices
Forecast horizons
- Sub-Hourly STF Improves Day-Ahead Positioning in the Era of Renewables
- Transforming Seasonal Load Risk Planning for Utilities
- Unlocking Intelligent Term Trading and Seasonal Planning
- Can You Trade on a 3-Week Signal? Here's Proof.
- With Millions On the Line, Amperon Called Cold Snap 33 Days Out
- Europe's Shift to 15-Minute Power Markets
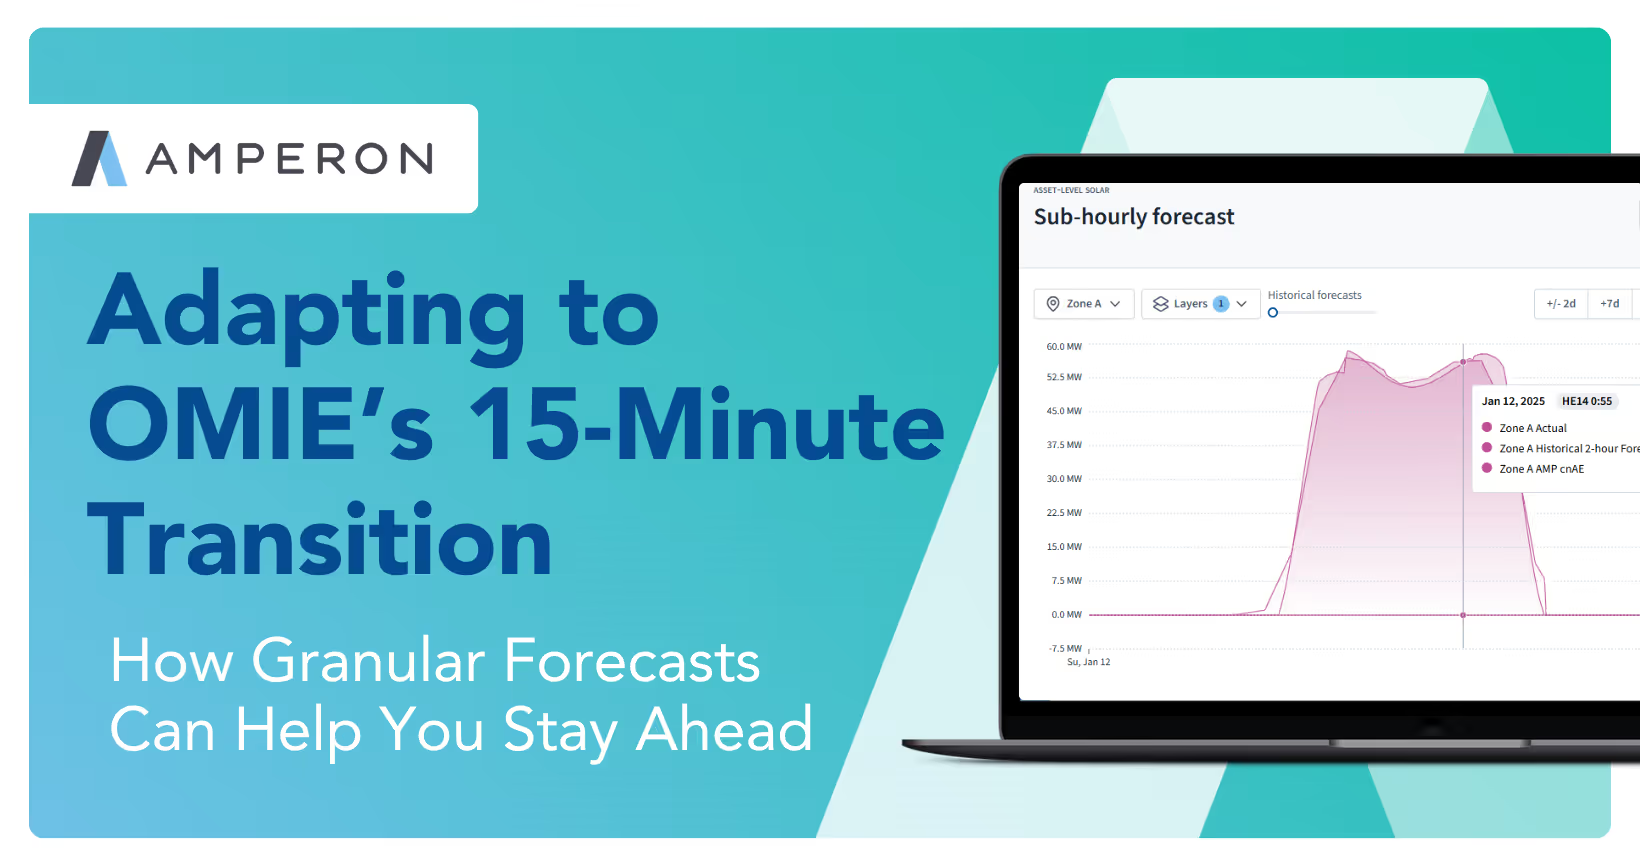
- Adapting to OMIE's 15-Minute Transition: How Granular Forecasts Can Help
What drives electricity demand
- Forecasting for the holidays: How holidays affect demand patterns
- Forecasting for the Super Bowl: How much does the big game really affect demand?
- 2024 Energy Demand Trends: What Happened During 3 Recent EU Holidays
- What the beginning of daylight savings time means for peak pricing
- Electrification and BTM Solar: Reshaping Demand in ISO New England
- How the Transition from Gas to Electric Heating is Changing Demand Forecasting
- Why Behind-the-meter Solar Complicates Spring Forecasting
- How Storms Compound Risk
- Winter Storm Fern: A Case Study and Q&A with Amperon
Structural load growth and data centers
- Data Center Energy Demand: The Top 5 Considerations for Power Traders
- Why Virginia Data Centers Matter to All of PJM
- Can PJM Keep Up with Exponential Load Growth?
- Could Small Modular Reactors Close the Gap on AI's Energy Demand?
- Why Data Centers are Moving Beyond Renewable Energy PPAs
Net demand and net load
- Two Perspectives on Net Load Forecasting
- How to Use Wind and Solar Forecasts: Net Load Forecasting and Day-Ahead Optimization
- Granular insights from grid net demand forecasts: Importance of zone-level forecasting
- The Rise of the Duck Curve in ERCOT
- The Duck Curve and Utilities' Emerging Seasonal Risks
- The Shape Shift: How Texas Net Demand Transitions from Shoulder to Summer
- Best Demand and Net Demand Forecasting Calls to End 2024
- High Net Demand and Outages Caused Recent Price Spike in ERCOT
Peak demand and coincident peak
- What Is 4CP? ERCOT's Coincident Peak Program Explained
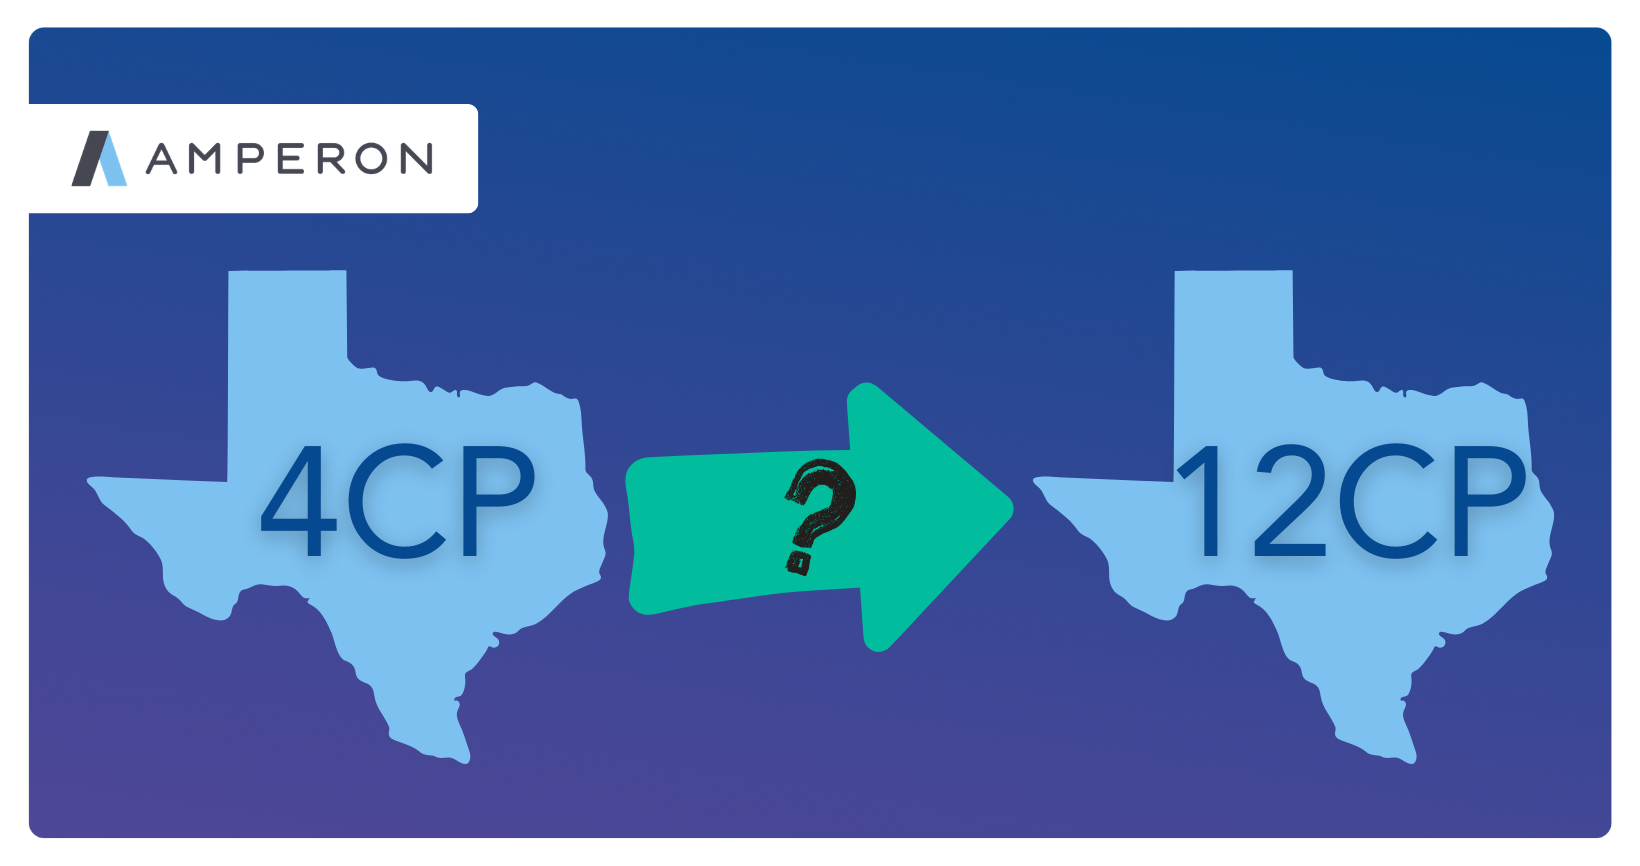
- ERCOT 12CP: Why Texas is Moving from 4CP to Monthly Coincident Peaks
- Coincident peak season is coming
- Coincident Peaks in ERCOT: The Significance of Timely Alerts
- Nailing MISO's Fall 2025 Coincident Peak: A Week-Ahead Perfect Call
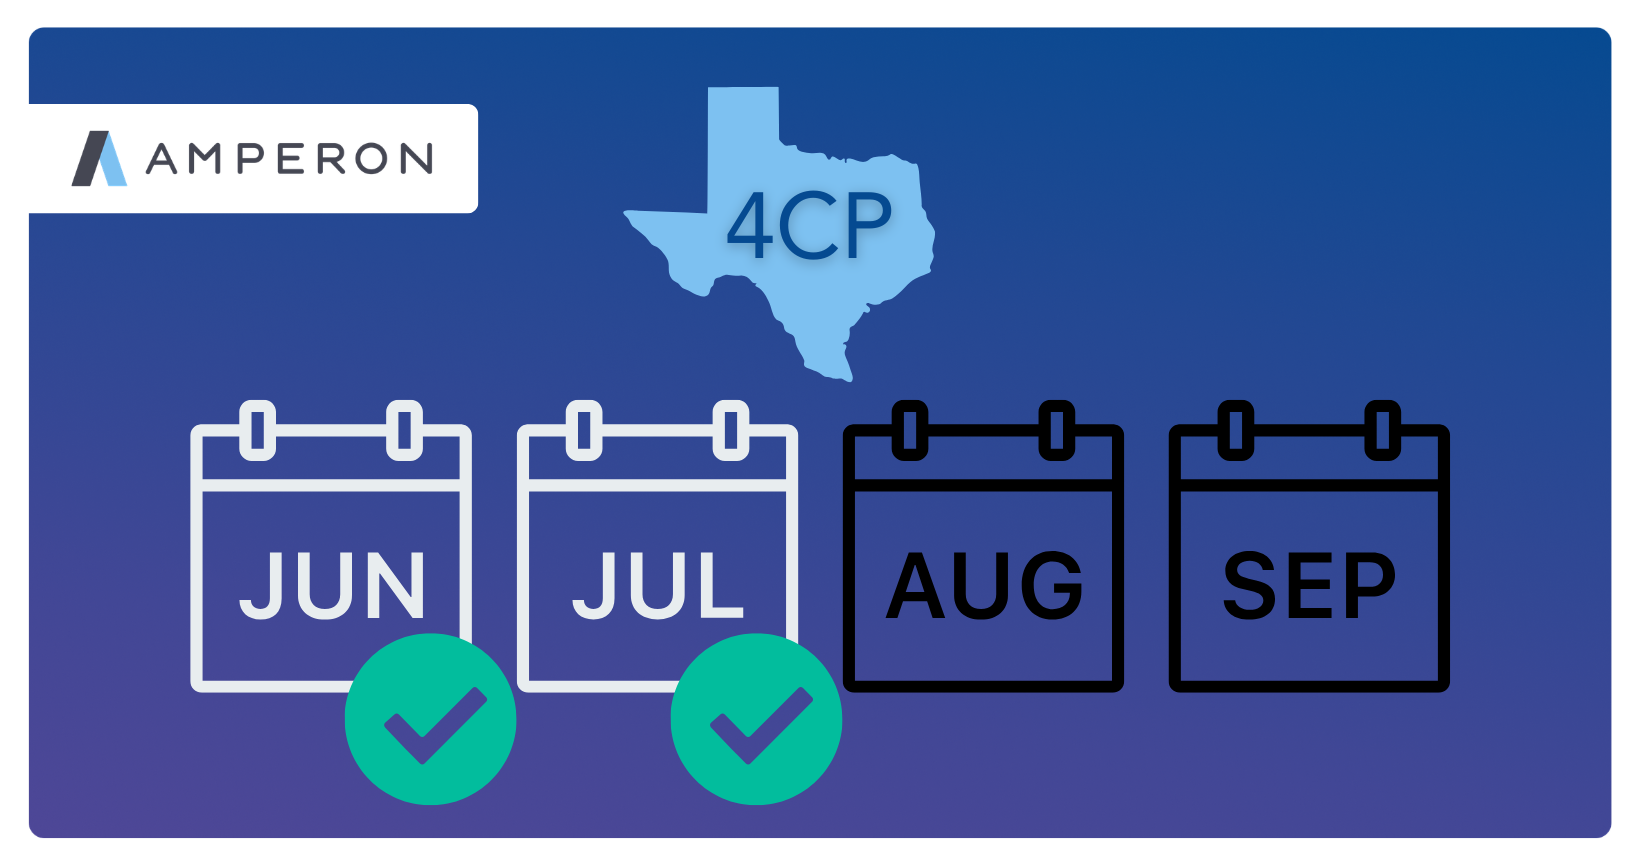
- Amperon's 4CP Performance: June-July 2026
Measuring forecast accuracy
- The different kinds of forecasting accuracy metrics
- Understanding the Benefits of NMAE over MAPE for Estimating Load Forecast Accuracy
- cnMAE: The Right Metric for Evaluating Solar & Wind Forecasts
- Navigating error measurements for wind and solar generation — the case for cnMAE
- Why solar forecasts and accuracy metrics are a big deal
- 7x Better than ERCOT: How Amperon Maintained Accuracy in Unusual Conditions
Demand forecasting by market
- Why Wholesale Electricity Prices are ESPECIALLY Volatile in Texas (ERCOT)
- Uri vs. Fern: How ERCOT Learned to Bend Without Breaking (ERCOT)
- Behind PJM's 800% Increase in Capacity Prices (PJM)
- ISONE's First Heat Spike of Summer — and Amperon Nailed It (ISO-NE)
- CAISO Breaks the Transmission Hedge (CAISO)
- MISO's VOLL Change Could Reshape Scarcity Pricing and Reliability Signals (MISO)
- The Pacific Northwest Risks a 6 GW Shortfall This Winter (WECC)
- A Tale of Three Markets: The Winds of Change Blow Differently Across Europe
- Mexico's Grid Is Waking Up. Are Market Participants Ready?
- PJM Breaks 10-Year Peak Load Record — and Amperon Saw It Coming 7 Days Out
Who uses demand forecasting
- Powering Profitable Growth for Retail Electricity Providers
- How Munis and Coops Can Benefit from Advanced Forecasting Platforms
- How Forecasting Helps C&I Operations Cut Energy Bills
- From bitcoin to grocery stores, how C&I can manage risk in the wholesale market
- Virtual Power Plants 101: How They Work and Why Forecasting Accuracy Matters
- The Art of Resource Adequacy
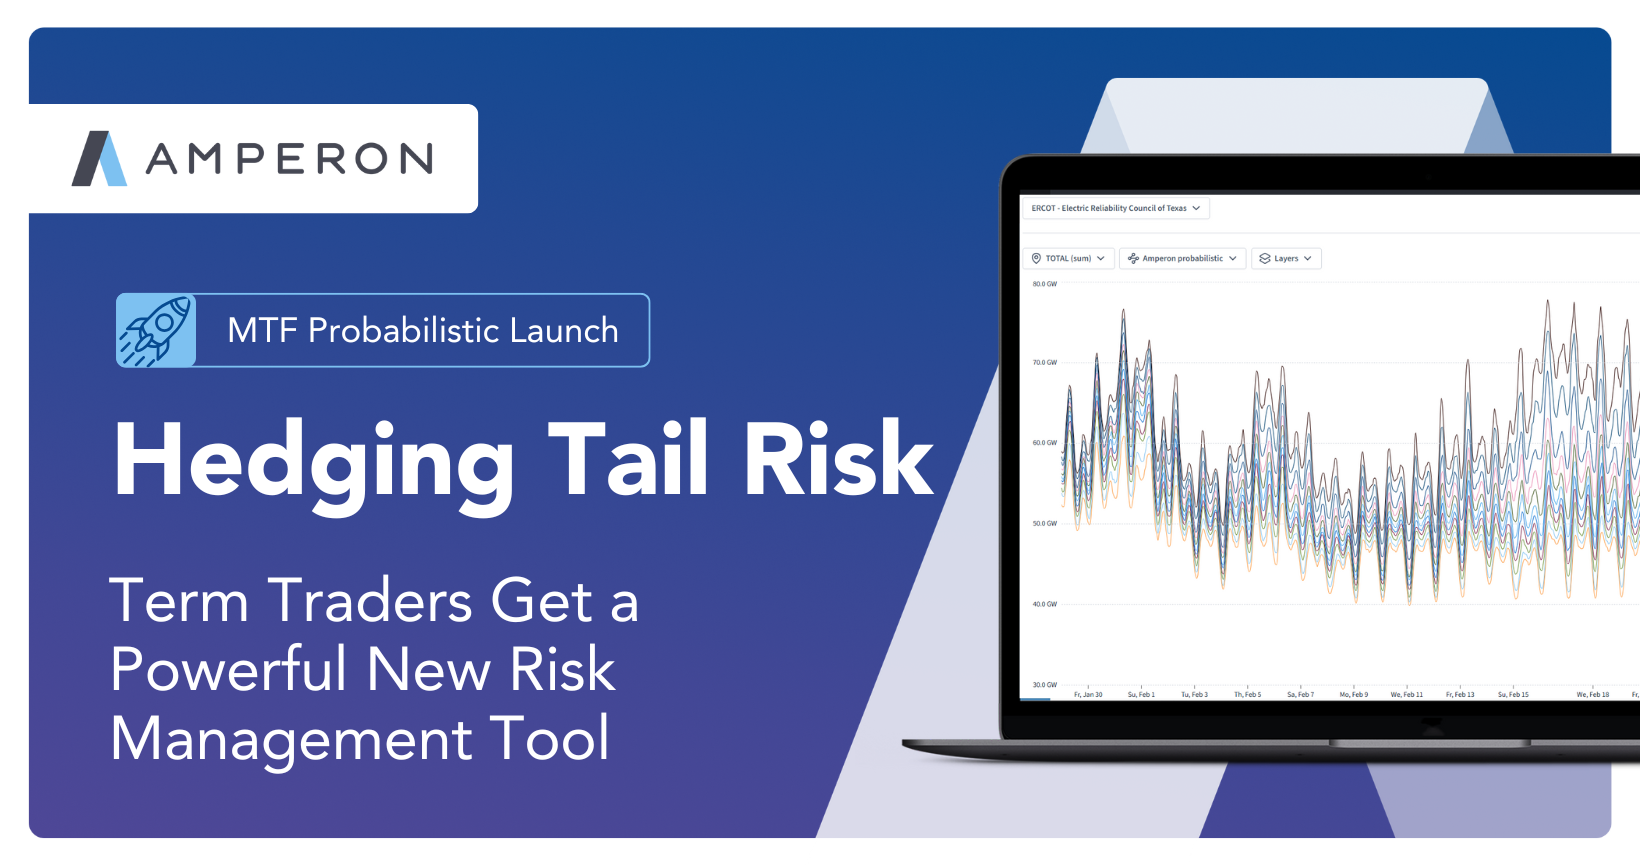
- Hedging Tail Risk: Term Traders Get a Powerful New Risk Management Tool

.svg)



































%20(3).png)
%20(2).png)
%20(1).png)





.png)


.avif)



.avif)
.avif)

.avif)
.avif)
%20(15).avif)
.avif)


.avif)

.avif)
.avif)