

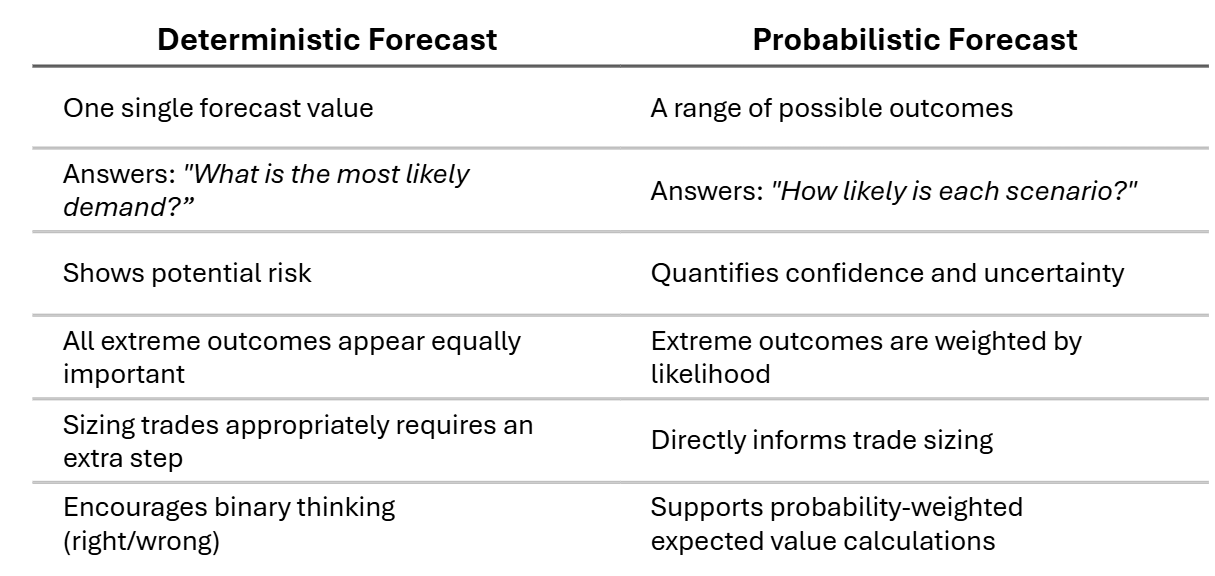
Most energy forecasts give you one number—but the future isn’t that simple. Amperon’s new probabilistic grid demand Mid-Term Forecast (“Grid MTF”) goes further, showing the full range of plausible outcomes along with the likelihood of each scenario.
Last year, Amperon leapfrogged traditional mid-term forecasting with the industry’s first weather-informed Grid MTF, providing forward-looking seasonal and sub-seasonal insights rather than backward-looking averages. This has given users unprecedented advance notice of extreme events. Yet, term traders and load risk managers were forced to guess how seriously to treat these scenarios.
Today, probabilistic mid-term forecasting helps users make risk-weighted decisions by:
- Visualizing the full range of likely outcomes
- Quantifying confidence intervals and probability outcome of scenarios
- Understanding the potential impact of extreme scenarios
Why Probabilistic Forecasting Matters for Power Traders
Energy markets don’t just reward accuracy—they reward risk management. For example, a 74,000 MW winter peak might appear in a deterministic ensemble, but probabilistic forecasting tells you it only has a 5% chance of occurring. That understanding informs a more fine-tuned trading and hedging strategy.
Measuring risk helps traders determine how aggressive to be and how much to hedge. Tighter ranges can signal higher-confidence trading opportunities, while wider spreads can flag periods of higher risk.

It works a bit like a financial portfolio: instead of betting everything on one deterministic number, users can calibrate position size and avoid under- or over-hedging. Without probabilities, traders often either over-react to worst-case scenarios or ignore risk until prices have already spiked.
Many traders and risk managers already create their own load forecasts to translate weather data into demand, but Amperon’s new features could help them save multiple hours per week while benefitting from continuous model learning.
This nuanced information not only saves time, but also supports clients looking to conduct expected value analysis to determine the net impact of a range of likely scenarios. This helps answer the question: “How bad would it be if I’m wrong?"
Answer the question: “How bad would it be if I’m wrong?"
Probabilistic Forecasting Methodology
By combining the industry’s gold-standard weather forecasts from ECMWF with best-in-class hourly load modeling, Amperon predicts and calibrates probability quantiles using separate regression models (gradient-boosted trees) for each weather-informed starting point.
Actuals are continuously fed into training data to improve calibration over time. In other words, a scenario labeled as P20 means load should actually fall below this value roughly 20% of the time. Likewise, a P20 to P80 range indicates that load should actually fall within this interval 60% of the time.
This approach intrinsically captures both weather uncertainty and temporal context. Raw weather ensembles provide distributional shape, while Amperon’s load models account for variations due to hour of day, day of week, month, season, and peak patterns.
Amperon’s load models account for variations due to hour of day, day of week, month, season, and peak patterns.
Probabilistic Forecasting Metrics
Load forecasting has historically been evaluated using deterministic accuracy metrics such as Mean Absolute Percentage Error (MAPE) or Root Mean Squared Error (RMSE). Probabilistic load forecasts require evaluation frameworks that assess the accuracy, reliability, and consistency of the full distribution rather than a single expected value:
- Quantile loss or pinball loss measures how well each forecasted quantile performs relative to its intended probability. Lower loss means better accuracy for individual quantiles like P10, P50, and P90.
- Coverage error or coverage reliability tracks whether forecasted probabilities match observed outcomes over time. Deviations indicate whether your confidence levels are trustworthy for sizing trades.
- CRPS (Continuous Ranked Probability Score) evaluates the entire forecast distribution by comparing it to observed outcomes. It captures both sharpness (precision) and calibration (reliability), giving traders the risk detail they need to size positions appropriately.
Read more about probabilistic forecasting methodologies and evaluation in Amperon’s white paper, The Future of Term Trading: Quantifying Tail Risk.
Conclusion
With probabilistic forecasting, power traders can capture more alpha—and avoid losing it all during surprise weather and load events.
It helps traders:
- Understand risk before it shows up in energy prices
- Size trades with confidence
- Separate probable outcomes from unlikely extremes
Instead of reacting to uncertainty, term traders can finally price it in. Don’t hide from risk—see it, measure it, and manage it. Because your biggest risk is not knowing how wrong you could be.
Don’t hide from risk—see it, measure it, and manage it.
Amperon’s Probabilistic Grid Demand Mid-Term Forecast is now available for all US ISOs / RTOs and zones, via our platform or API, for both 46-day and 7-month time horizons. Request Backtests


.svg)


%20(3).png)
%20(2).png)
%20(1).png)


.png)


.avif)


.avif)

.avif)


.avif)


.avif)
%20(15).avif)

.avif)


.avif)


.avif)

.avif)


.avif)


