Financial Transmission Rights (FTRs) protect holders against losses related to grid congestion. If overloaded transmission lines prevent electricity from getting from point A to point B, FTRs make asset owners and other power market participants whole again.
FTR trading tools historically use nodal pricing models to predict prices at an extremely granular level, but these models don't resolve in time to inform FTR auctions.
Amid an accelerating grid transformation, FTR trading strategies are evolving to include system-level forecasts, which provide traders with a leading indicator of tight conditions.
What FTRs are and who trades them
An FTR (or CRR, Congestion Revenue Right, depending on the market) is a financial contract that pays its holder based on the congestion price difference between a specific source and sink over a defined period. Utilities, asset owners, and financial traders all use FTRs, for different reasons.
Physical hedgers include utilities, load-serving entities, and generators carrying real delivery obligations. A wind farm in West Texas selling into a load center has a genuine financial problem if transmission clogs and the price at the farm collapses while the load center spikes. An FTR along that path pays out when congestion prevents the sale of electricity.
Financial trading desks look to profit from FTR trading even though they don't own generation assets or wires. They use FTR analytics to predict which constraints will bind using meteorological data, topology models, and historical dispatch, then buy paths cheaply in auctions and collect when congestion materializes.
Why the grid has stopped repeating itself
Financial transmission rights sit at an awkward intersection. These instruments settle on the price spread between two specific nodes on the grid, which makes the exposure intensely local. Yet the conditions that cause a price difference are regional, and increasingly driven by macro-level grid trends like data center energy demand, extreme weather, and renewable energy curtailment.
The conditions that cause a price difference are regional, and increasingly driven by macro-level grid trends like data center energy demand, extreme weather, and renewable energy curtailment.
And congestion is quickly getting more expensive. PJM congestion costs rose from approximately $1.8B in 2024 to $3.2B in 2025 as demand climbed from data centers, industrial load, and electrification. They then climbed another 180% in the first half of 2026, reaching roughly $3.54 billion against $1.26 billion in the comparable period in the year prior.
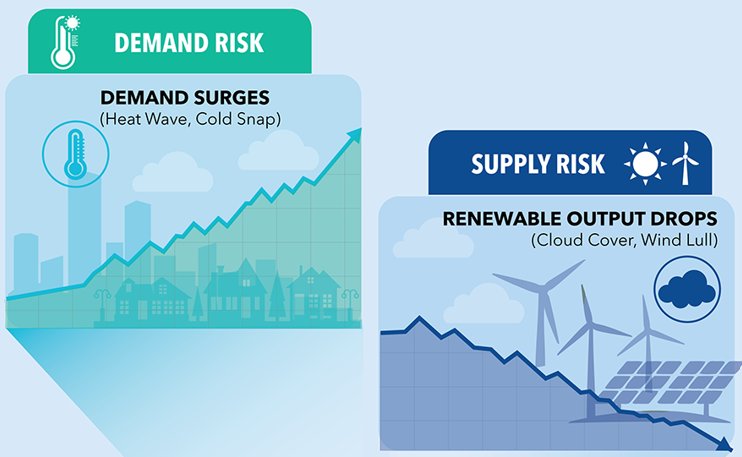
The nature of the problem has also changed. Through 2024, the most severe congestion reflected a supply-side mismatch, with remote wind and solar stranded behind constraints and far from load. The newer pressure comes from the demand side, concentrated in corridors the existing grid was never designed to serve at that density.
The newer pressure comes from the demand side, concentrated in corridors the existing grid was never designed to serve at that density.
Intensifying extreme weather adds further volatility. January 2026 produced nearly three times the FTR profitability of most other months in the study period, which points to weather-driven congestion as one of the strongest contributors to FTR value.
All three of these trends undermine the assumption that congestion patterns from prior years are a reliable predictor of the future. As a result, FTR trading desks are increasingly relying on system-level forecasting as a leading indicator of the tight conditions that can give rise to nodal-level congestion pricing.
All three of these trends undermine the assumption that congestion patterns from prior years are a reliable predictor of the future.
System-level congestion signals
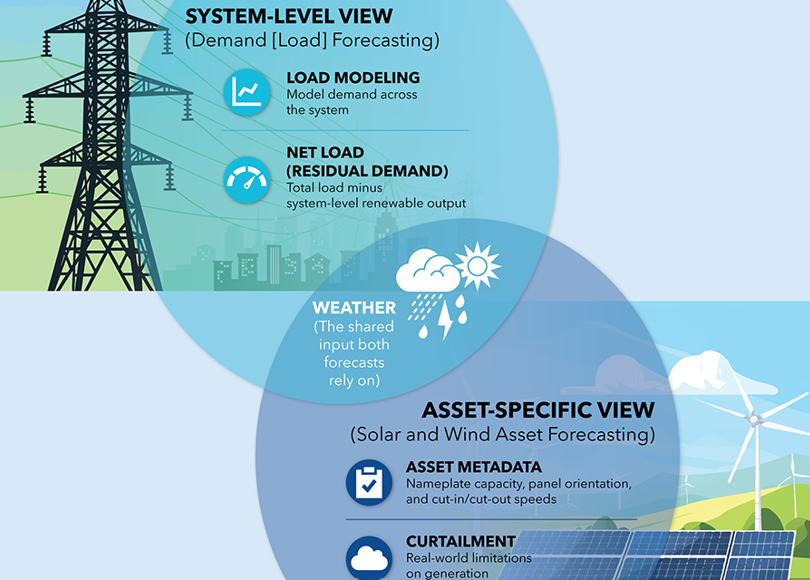
System-level forecasts provide a leading indicator of conditions under which binding constraints become more likely and more severe. They answer the question of where conditions are heading, on top of which FTR desks apply their own constraint modeling and shift factor analysis.
System-level forecasts provide a leading indicator of conditions under which binding constraints become more likely and more severe.
Seasonal demand forecasts and the auction timing problem
Annual and seasonal FTR auctions clear months ahead of delivery, well outside the range of nodal grid demand or price forecasts. Traders bidding those auctions need a view of whether the coming season will depart from the climatological baseline.
Annual and seasonal FTR auctions clear months ahead of delivery, well outside the range of nodal grid demand or price forecasts.
Amperon's seasonal grid demand forecasts and meter demand forecasts can help fill the gap. A grid-level demand forecast indicating that the coming winter will run materially colder than the thirty-year normal across a given footprint is an early signal that structural flows will diverge from the historical record.
Short-term forecasting between auctions
Once positions are on, FTR traders can use net demand, renewable generation, and price forecasts to inform monthly and balance-of-period auctions and to analyze ongoing portfolio risk.
Once positions are on, FTR traders can use net demand, renewable generation, and price forecasts to inform monthly and balance-of-period auctions and to analyze ongoing portfolio risk.
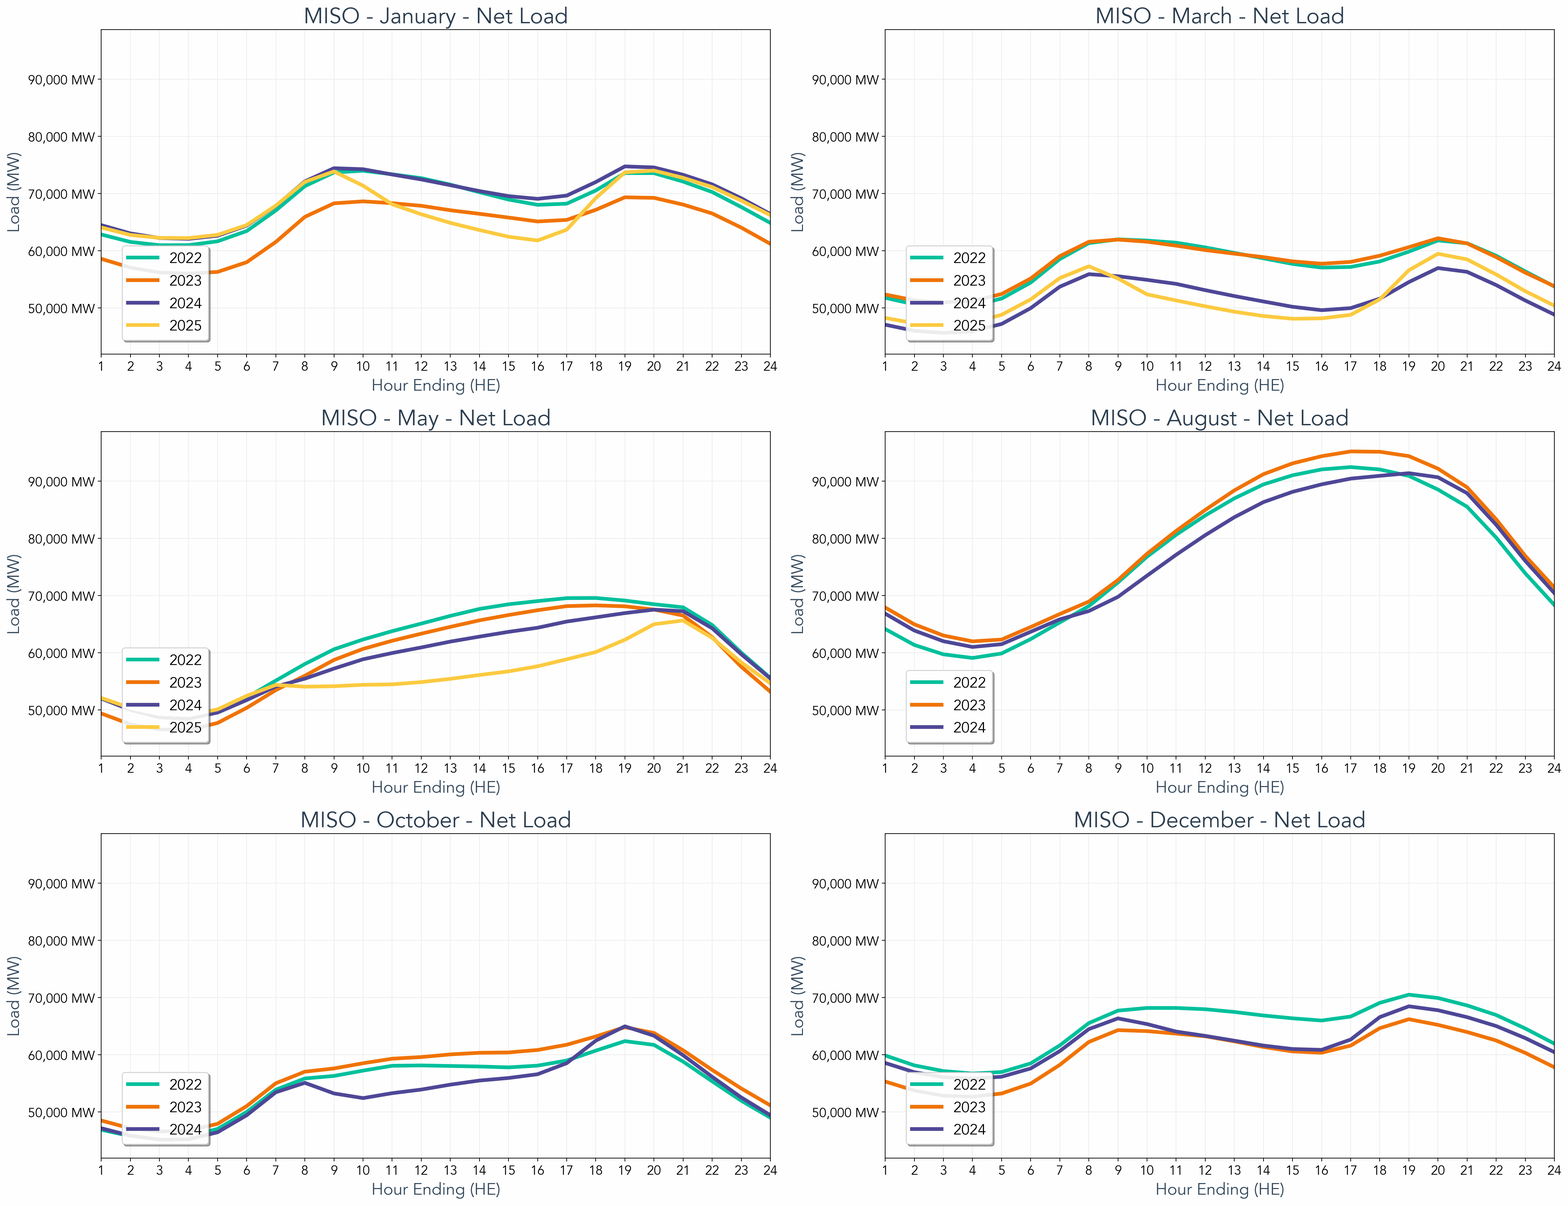
Amperon's short-term net demand forecasts capture tight conditions 0 to 14 days out. Steep evening ramps, low-wind stretches during high load, and midday solar surpluses each produce characteristic flow patterns across a region, and each tends to stress different corridors.
Renewable asset forecasting fills in the supply side at the asset and fleet level. For an IPP or trader holding an FTR path sourcing from a wind-heavy zone, the expected output profile over the coming days shapes the expected congestion pattern along that corridor.
Amperon's price forecasts add a third layer. Day-ahead price forecasts run 0 to 14 days out, reaching into the window when monthly and balance-of-period auctions clear. Then, up to 3 days out, running real-time price forecasts alongside day-ahead price forecasts can support the DART spread strategies that traders often run alongside their congestion books.
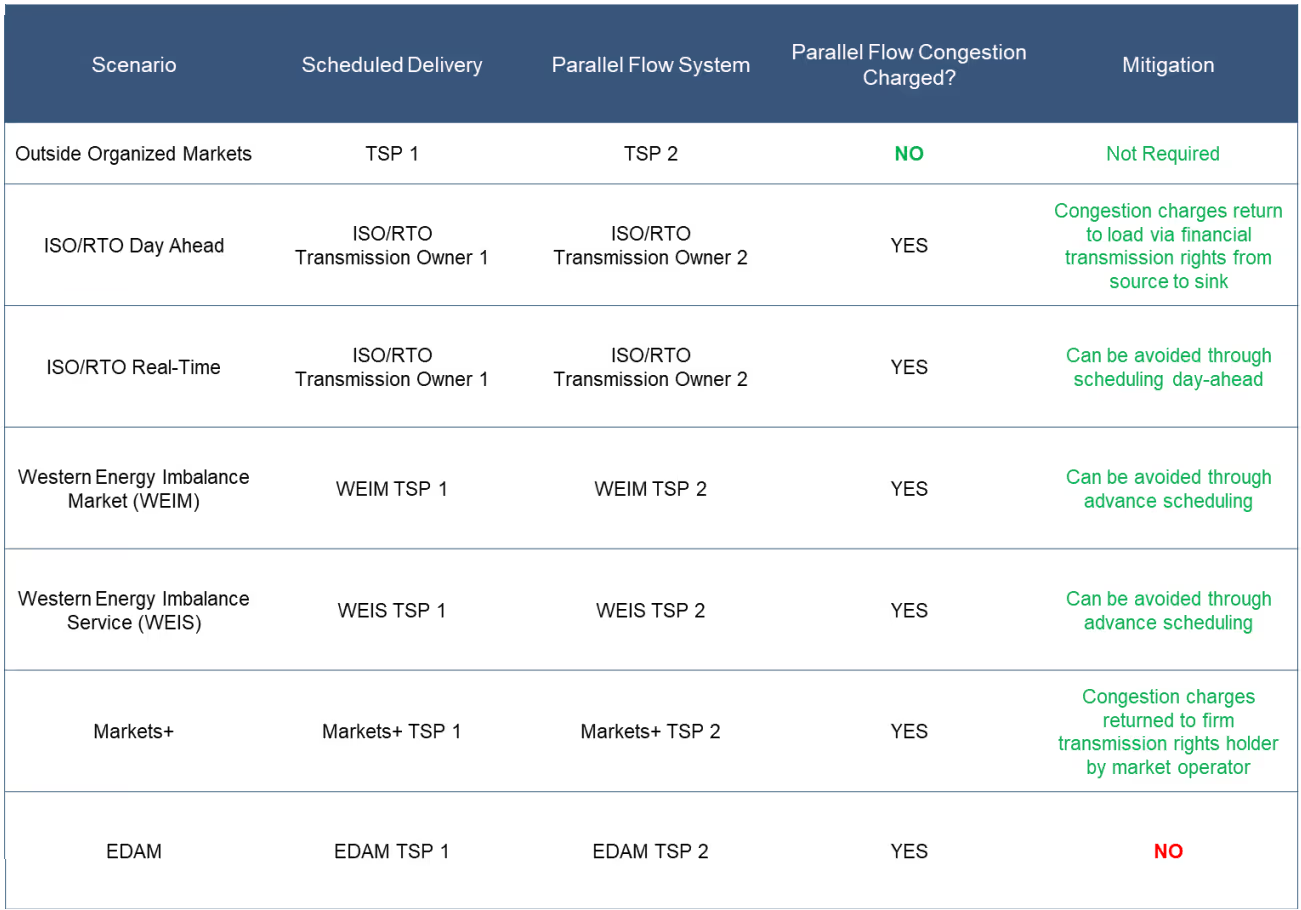
Summary Table
Note: Amperon does not provide nodal LMP forecasts, nodal congestion forecasts, or constraint-level shift factor modeling.
Explore Power Markets Trading Solutions
FTR Trading FAQs
What are financial transmission rights?
Financial transmission rights (FTRs) are a hedge against locational basis risk. In other words, they insure against a price spread between two specific nodes on the grid. FTRs are distinct from physical or energy positions, as they are a financial hedge rather than a physical one. FTRs don't ensure energy gets delivered, but they do make asset owners whole if they lose revenue due to congestion-driven losses.
What's the difference between FTRs and CRRs?
There is effectively no difference between FTRs (Financial Transmission Rights) and CRRs (Congestion Revenue Rights); they are two different names for the same thing. Some markets, namely ERCOT and CAISO, use CRRs, while others like PJM, ISO-NE, and MISO use FTRs.
How do FTR auctions work?
Most US grid operators run an annual auction covering the planning year, typically in multiple rounds, followed by monthly or balance-of-period auctions closer to delivery. The annual auction sets the bulk of positions. The shorter-dated auctions let participants add exposure, reduce it, or reconfigure paths as conditions change. Some operators also offer longer-dated products beyond the prompt planning year, which extend forward price transparency further out.
How do FTR traders use grid forecasting?
FTR traders use net demand forecasting at the grid, hub, and zonal levels as a risk screening layer that sits above nodal forecasts, since nodal forecasting is expensive and noisy. Binding transmission constraints are driven by aggregate supply-demand imbalance across regions, so FTR and CRR traders use these higher-level forecasts as leading indicators to anticipate which corridors are likely to see tight conditions long before they appear in nodal models. Once they identify a likely region, they then drill into nodal level shift factor analysis to determine specific FTR or CRR positions.
How do FTR traders use renewable energy forecasting?
FTR and CRR traders use renewable generation forecasts as an input to determine which transmission lines are likely to become congested. Grid congestion can arise from either too much supply or too much demand—or very often, both. Traders typically look for the corridors connecting areas with high expected renewable energy output to areas with high demand, as these are often where conditions are tightest.
Does Amperon provide nodal forecasts?
No, Amperon provides grid-, grid, hub-, and zonal-level demand and net demand forecasts, but it does not provide nodal forecasts.
How do Amperon's forecasts fit into an FTR trading workflow?
Amperon delivers forecast through its user interface or through API, flat file exports, or a native Snowflake integration so traders can bring system-level context into the FTR trading or congestion modeling tools they already use.

.svg)






























%20(3).png)
%20(2).png)
%20(1).png)





.png)


.avif)



.avif)
.avif)

.avif)
.avif)
%20(15).avif)
.avif)


.avif)

.avif)
.avif)