Product Launch
New Product Alert! Probabilistic Asset Solar and Wind Short-Term Forecasts
Learn More

Amperon's 4CP Performance: June-July 2026

4 hours a summer dictate a year of demand charges for Texas LSEs and C&I energy users. Amperon flagged ERCOT's first two 2026 4CP hours over a week out.

Taylor Jean
July 27, 2026
July 24, 2026

Summary

1
Amperon called ERCOT’s two biggest peaks so far with over a week’s notice.
2
CP risk scores reached 100 six days out for July 22 and never wavered.
3
The remaining two 4CP days typically carry the highest system load.
4
4CP June-July calls

Every summer, four hours determine a year of demand charges for Texas load-serving entities and large energy users.

ERCOT's 4CP (four coincident peak) mechanism sets transmission cost allocation based on system load during the highest-demand interval in each of June, July, August, and September. Missing a curtailment window in one of those months means paying, year-round, for capacity you didn't need to use.

This summer, Amperon's 4CP Alert product called the two biggest system peaks so far, and it called them early.

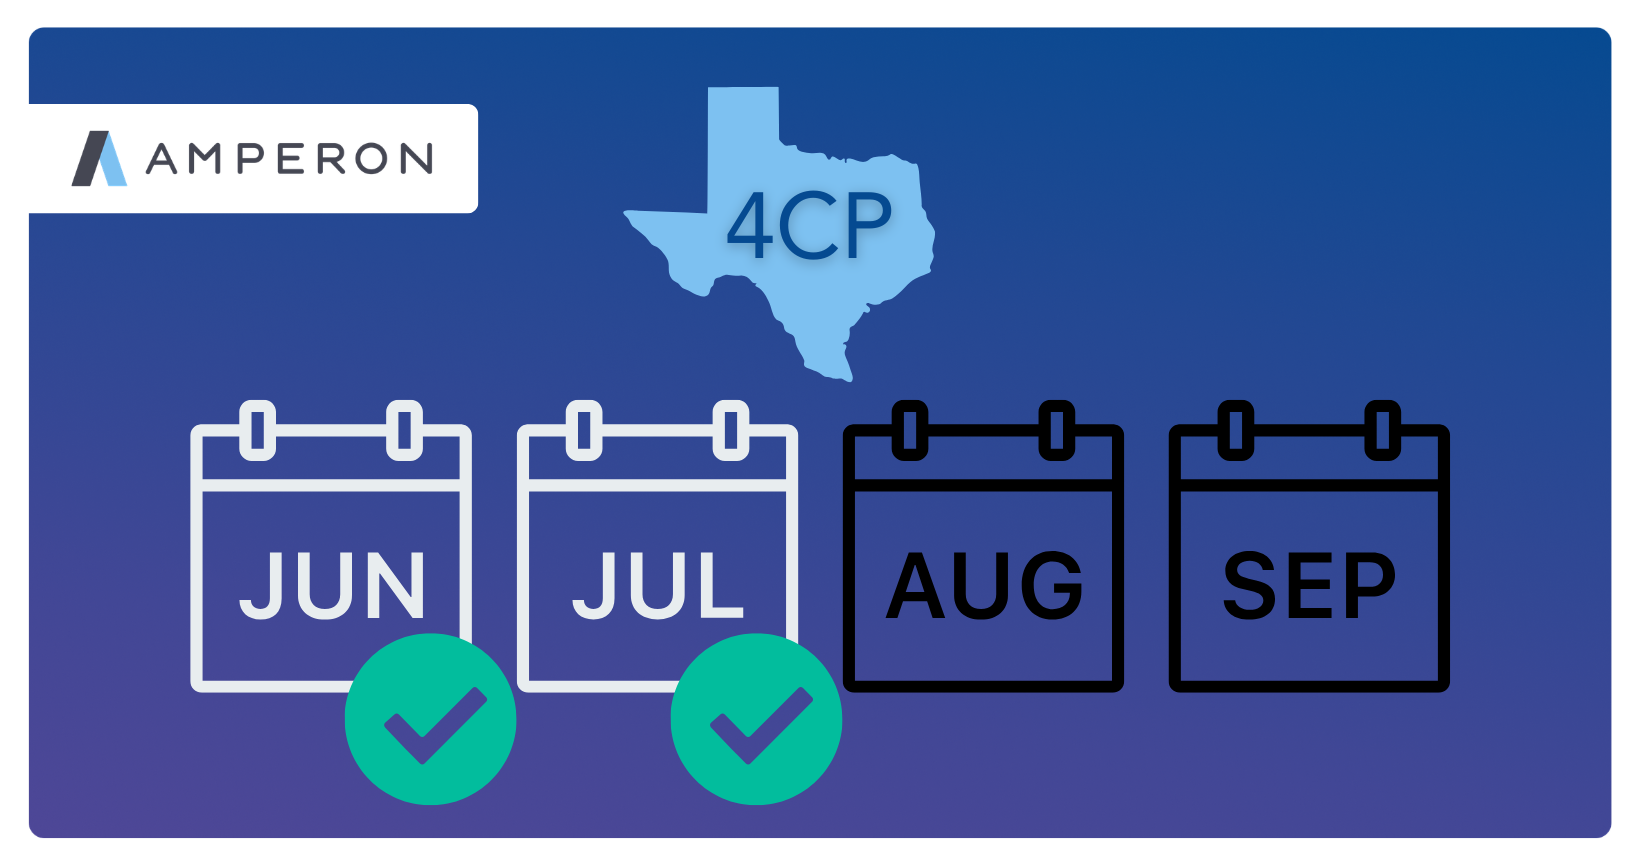
It's not official yet. ERCOT publishes final 4CP settlement days at the end of the season. But based on system load data so far, June 18 and July 22 look like they'll hold as two of the four.

Amperon's 4CP Alert product called the two biggest system peaks so far, and it called them early.

Amperon's June and July 2026 4CP Calls

Amperon flagged June 18 and July 22 as 4CP risk days more than a week before either occurred. Both calls held. ERCOT's system load peaked on exactly those two days, inside the afternoon window Amperon's models pointed to.

A week of lead time changes an operator's level of possible curtailment. Instead of scrambling to shed load on short notice, subscribers had time to line up shift schedules, pre-cool facilities, or coordinate with on-site generation, all before the peak hour arrived.

A week of lead time changes an operator's level of possible curtailment.

Confidence Well Before the Peak

Amperon issues two 4CP alerts a day, one overnight (3-4 AM) and one mid-morning (11 AM), each carrying a confidence score from 1 to 100. Here's how those scores tracked in the six days leading into both events:

Amperon 4CP performance June-July 2026

The July 22 call was as clean as it gets: both the overnight and 11 AM alerts sat at 100 a full six days out and never wavered. June 18 built more gradually, starting in the high-80s and low-90s six days ahead, then climbing alert by alert to a firm 100 two days before the peak. Either way, subscribers had a rising, trackable signal well before the event, not a last-minute flag.

The July 22 call was as clean as it gets.

Why Lead Time Matters More Than the Hour

Nobody nails the exact settlement interval every time. What separates a useful 4CP program from a coin flip is whether it gets you looking at the right day with enough runway to act. Amperon's forecast put both June 18 and July 22 on the radar over seven days out, well ahead of ERCOT's own peak-day confirmation. That's the lead time that allows operators to effectively execute a curtailment plan.

What separates a useful 4CP program from a coin flip is whether it gets you looking at the right day with enough runway to act.

Two Months Down, Two to Go

June and July are behind us. August and September are still live, and they're historically the months with the highest 4CP risk in ERCOT, as load climbs through the hottest stretch of the year.

If you're not already subscribed to Amperon's 4CP Alerts, the value of joining now is straightforward: two of the four coincident peaks for 2026 are already set, and the remaining two are the ones that typically carry the highest system load of the season.

Subscribing before ERCOT's CP season closes out means you're covered for the peaks that matter most to your bottom line.

Explore Coincident Peak Alerts

AI-driven Forecasting

Our advanced machine learning methodology delivers the accuracy you need to optimize operations and maximize profits.

  • 40K weather points from 4 vendors
  • 15-day short-term forecasts that update sub-hourly
  • Globally available
  • Leading UI/UX or API delivery
Book a demo

Want 3x more accurate forecasts? Let's talk.

Book a demo

Related articles

Left arrow icon for navigationRight arrow icon for navigation
Blog
July 27, 2026
Amperon's 4CP Performance: June-July 2026
Open article
Blog
July 23, 2026
Small Modular Reactors: Closing the Gap on AI’s Energy Demand
Open article
Blog
July 23, 2026
7x Better than ERCOT: How Amperon Maintained Accuracy in Unusual Conditions
Open article
Blog
July 23, 2026
Data Center Energy Demand: The Top 5 Considerations for Power Traders
Open article
Blog
July 23, 2026
July 2026 Heat Event: How A Trader Could Have Made +$200 to $400/MWh
Open article
Blog
July 23, 2026
Amperon Integrates AI Weather Forecasting from ECMWF
Open article
Blog
July 23, 2026
Early July Heat Wave 2026: Forecast Models Signal Rising U.S. Power Demand
Open article
Blog
July 23, 2026
Transforming Seasonal Load Risk Planning for Utilities
Open article
Blog
July 23, 2026
Mexico's Grid Is Waking Up. Are Market Participants Ready?
Open article
Blog
July 23, 2026
The Top 3 European Grid Risks This Summer
Open article
Blog
July 23, 2026
The Top 3 US Grid Risks This Summer
Open article
Blog
July 23, 2026
Why Virginia Data Centers Matter to All of PJM
Open article
Blog
July 23, 2026
2026 US Summer Grid Preview
Open article
Blog
July 23, 2026
Two Perspectives on Net Load Forecasting
Open article
Blog
April 28, 2026
How Storms Compound Risk
Open article
Blog
July 23, 2026
The Art of Resource Adequacy
Open article
Blog
July 23, 2026
Can You Trade on a 3-Week Signal? Here's Proof.
Open article
Blog
July 23, 2026
DAME Brings New Costs to CAISO Market Participants on May 1
Open article
Blog
July 23, 2026
Why Data Centers are Moving Beyond Renewable Energy PPAs
Open article
Blog
July 23, 2026
When Batteries Break Your Forecast
Open article
Blog
March 26, 2026
The War in Iran and What It Means for Energy Forecasting
Open article
Blog
July 23, 2026
Ontario’s Market Renewal Program is a Major Success—Yet Volatility Remains
Open article
Blog
July 23, 2026
Seasonal Change Brings Forecasting Problems—Unless Your Model is Built for It
Open article
Blog
July 23, 2026
A Tale of Three Markets: The Winds of Change Blow Differently Across Europe
Open article
Blog
July 23, 2026
Quantifying Solar and Wind Uncertainty with Probabilistic Forecasting
Open article
Blog
July 23, 2026
The Future of Term Trading: Quantifying Tail Risk
Open article
Blog
July 23, 2026
Mitigating Curtailment Risk With Smarter Wind and Solar Forecasting
Open article
Blog
July 23, 2026
cnMAE: The Right Metric for Evaluating Solar & Wind Forecasts
Open article
Blog
July 23, 2026
How to Use Wind and Solar Forecasts: Net Load Forecasting and Day-Ahead Optimization
Open article
Blog
July 23, 2026
Uri vs. Fern: How ERCOT Learned to Bend Without Breaking
Open article
Blog
February 3, 2026
Before the Cold Hit: Early Demand Signals Behind January’s Arctic-Driven Power Price Surge
Open article
Blog
July 23, 2026
The Evolution of Energy Forecasting: From Deterministic to Probabilistic
Open article
Blog
February 3, 2026
Hedging Tail Risk: Term Traders Get a Powerful New Risk Management Tool
Open article
Blog
July 23, 2026
Sub-Hourly STF Improves Day-Ahead Positioning in the Era of Renewables
Open article
Blog
July 23, 2026
Behind PJM’s 800% Increase in Capacity Prices and Trump’s Emergency Auction Plan
Open article
Blog
July 23, 2026
Germany Proves Transmission is Just as Critical as Generation
Open article
Blog
July 23, 2026
How Amperon Won the Holidays
Open article
Blog
January 23, 2026
6 Grid Trends to Watch in 2026
Open article
Blog
July 23, 2026
Battery Energy Storage: ERCOT vs. CAISO
Open article
Blog
December 19, 2025
European Power Traders Finally Get One-Stop Forecasting
Open article
Blog
July 23, 2026
The Pacific Northwest Risks a 6 GW Shortfall This Winter
Open article
Blog
July 23, 2026
With Millions On the Line, Amperon Called Cold Snap 33 Days Out
Open article
Blog
July 23, 2026
Chilean Solar and Wind Asset Owners Face Hourly Reporting Under New Market Structure
Open article
Blog
July 23, 2026
Can PJM Keep Up with Exponential Load Growth?
Open article
Blog
December 5, 2025
US Winter Weather Outlook 2025–2026: Mild on Paper, Volatile in Practice
Open article
Blog
July 23, 2026
Ontario’s Day-Ahead Market is a Renewables Profitability Test
Open article
Blog
July 23, 2026
US Solar and Wind Curtailment Is Exploding
Open article
Blog
July 23, 2026
Navigating the RTC+B Paradigm Shift
Open article
Case study banner reading “Nailing MISO’s Fall 2025 Coincident Peak” with a computer displaying grid demand forecasts
Blog
July 23, 2026
Nailing MISO's Fall 2025 Coincident Peak: A Week-Ahead Perfect Call
Open article
Amperon MTF model visualization displaying market trends and forecasts
Blog
July 23, 2026
Unlocking Intelligent Term Trading and Seasonal Planning  
Open article
Blog post header with palm tree in hurricane winds asking Why Has This Hurricane Season Been So Quiet with Amperon branding
Blog
December 5, 2025
Why Has This Hurricane Season Been So Quiet?
Open article
Table showing parallel flow congestion scenarios across different energy markets including ISO/RTO, WEIM, WEIS, Markets+, and EDAM with scheduled delivery systems and mitigation strategies
Blog
July 23, 2026
CAISO Breaks the Transmission Hedge
Open article
Amperon blog post graphic asking High ERCOT Demand, Low Wind, and No Price Spike? with load forecast chart for August 18, 2025
Blog
December 5, 2025
High ERCOT Demand, Low Wind, and No Price Spike?
Open article
ISONE May hourly average load comparison chart showing data from 2023, 2024, and 2025 with peak loads around 13,534 MW at HE17-18
Blog
July 23, 2026
Electrification and BTM Solar: Reshaping Demand in ISO New England
Open article
Line graph showing MISO Net Load from 2022-2025 comparing hourly load patterns ranging from 50,000 to 90,000 MW across 24-hour period
Blog
July 23, 2026
The Rise of the Duck Curve in ERCOT: A Shift in Net Demand Peak and the Future of Solar Power Integration
Open article
Amperon market analysis titled Where's the Chaos? ERCOT's Surprisingly Quiet Summer with curved line graph showing peak demand trends from 2022-2025
Blog
December 5, 2025
Where’s the Chaos? ERCOT’s Surprisingly Quiet Summer
Open article
Amperon forecasted load versus prediction time by weather vendor chart for PJM on June 24, 2025, showing settled demand at 158.2 GW with multiple vendor forecasts (ENS_1, NBM, DTN, AG2)

Blog
July 23, 2026
PJM Breaks 10-Year Peak Load Record — and Amperon Saw It Coming 7 Days Out
Open article
Blog
July 23, 2026
PJM Forecast: June 23–25 Heat Wave May Shatter Summer Expectations
Open article
Blog
July 23, 2026
ISONE’s First Heat Spike of Summer- and Amperon Nailed It
Open article
Amperon whitepaper cover titled Cost of Uncertainty: The Challenges and Value of Accurate Price Forecasting with download button, dated March 2025
Blog
July 23, 2026
Why Wholesale Electricity Prices are ESPECIALLY Volatile in Texas
Open article
Blog
July 23, 2026
Powering Profitable Growth for Retail Electricity Providers: Turn Load Forecasting into Your Competitive Edge
Open article
Blog
July 23, 2026
Navigating ERCOT’s 4CP Program: Key Updates and Strategic Preparation for 2025
Open article
Amperon promotional banner announcing sub-hourly grid forecasts for European TSOs now available, featuring transmission tower with geometric orange and blue design elements
Blog
December 10, 2025
Europe’s Shift to 15-Minute Power Markets: How Amperon Helps You Prepare for Market Evolution
Open article
Amperon blog post graphic titled "The Shape Shift: How Texas Net Demand Transitions from Shoulder to Summer" with wind turbine image
Blog
July 23, 2026
The Shape Shift: How Texas Net Demand Transitions from Shoulder to Summer
Open article
Amperon presentation slide titled "ERCOT's Evolving Price Dynamics 2021-2024 Analysis" with sunset transmission tower image
Blog
July 23, 2026
ERCOT’s Evolving Price Dynamics [2021-2024 Analysis]
Open article
A promotional image announcing the introduction of real-time grid price forecasts now live in ERCOT, featuring Amperon branding
Blog
July 23, 2026
Amperon Expands Forecasting Capabilities with Real-Time Price Predictions in ERCOT
Open article
Blog
July 23, 2026
MISO’s VOLL Change Could Reshape Scarcity Pricing and Reliability Signals
Open article
Blog
July 23, 2026
Why Behind-the-meter Solar Complicates Spring Forecasting
Open article
Comparison table showing solar and wind forecasting capabilities across Machine Learning, Physics-based, and Amperon (ML+PB) approaches for partial asset metadata, soiling, equipment degradation, biased weather, and curtailment
Blog
July 23, 2026
How to Forecast Energy Generation for Wind or Solar Assets
Open article
Day-ahead grid MAPE summary table for 2024 showing 12-month average comparison of ISO MAPE, Amperon MAPE past models, current models, and improvement percentages across multiple ISOs (AESO, CAISO, ERCOT, ISONE, MISO, NYISO, PJM, SERC, SPP, CH, DK, ES, IE)
Blog
July 23, 2026
Always Innovating: Amperon’s New Techniques to Improve Energy Forecasting
Open article
Amperon recap slide for April 7 titled "Why prices in ERCOT soared to $4000 per MW" with pastoral field landscape at golden hour
Blog
July 23, 2026
High Net Demand and Outages Caused Recent Price Spike in ERCOT
Open article
Amperon ebook promotional banner "Price Forecasting: Cost of Uncertainty - The Challenges and Value of Accurate Price Forecasting" with free ebook download button on gradient blue-green background
Blog
July 23, 2026
Are ERCOT’s morning ramp DA prices really higher than summer?
Open article
Infographic titled "Types of Data Relevant to Both Solar and Wind Assets" showing three categories: Nameplate Capacity, Location of Asset, and Historic Curtailment with wind turbines and solar panels imagery
Blog
July 23, 2026
Inside our Data: Intro to Renewable Asset Data
Open article
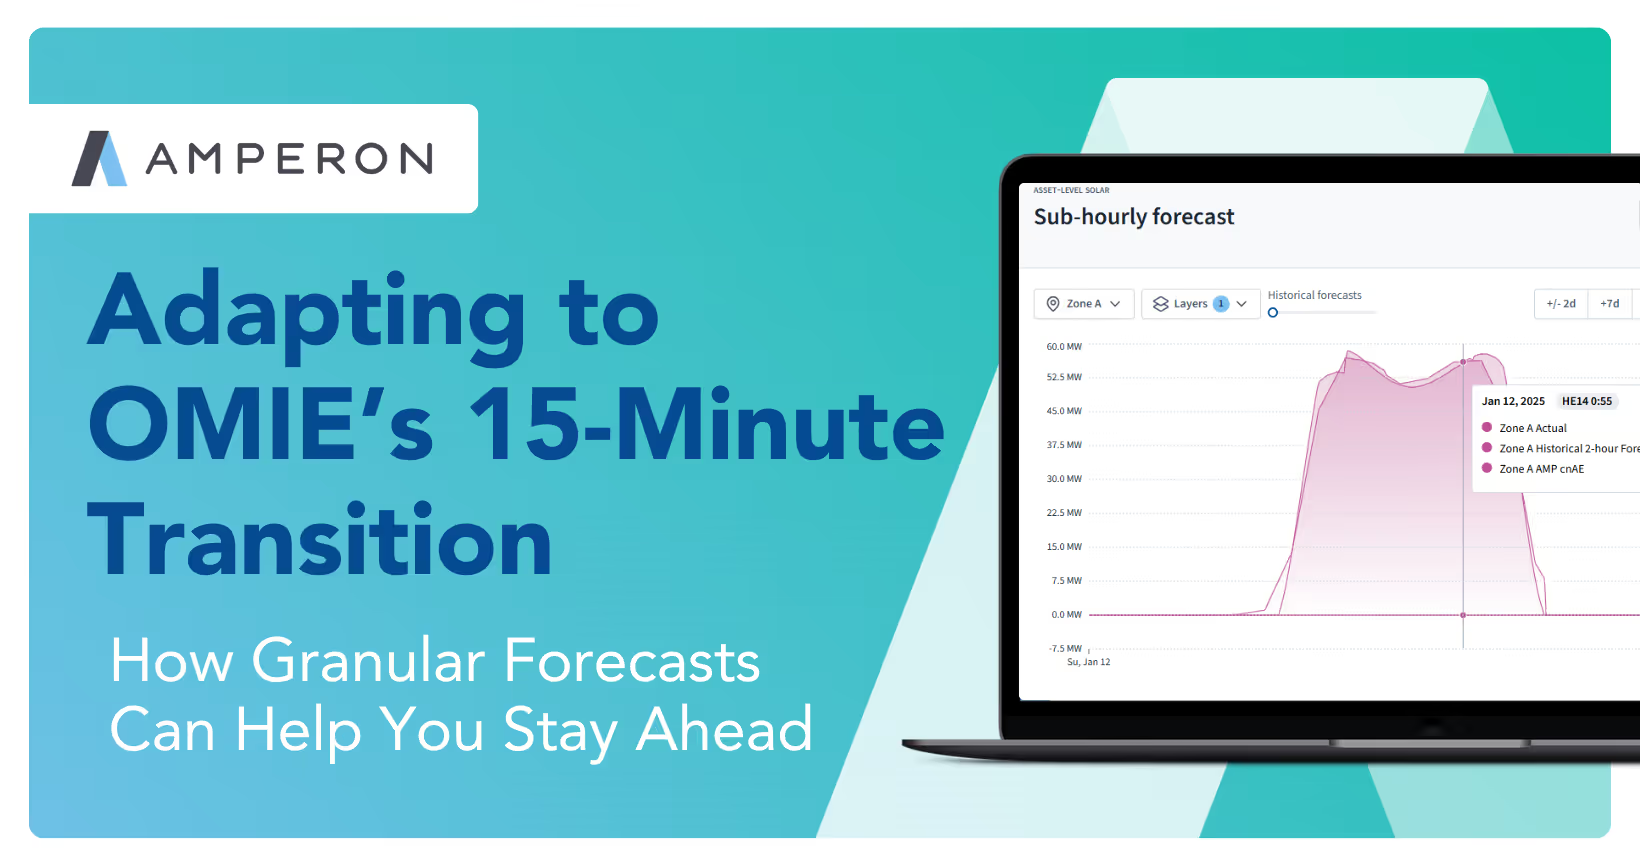
Amperon promotional slide "Adapting to OMIE's 15-Minute Transition: How Granular Forecasts Can Help You Stay Ahead" with laptop showing asset-level solar sub-hourly forecast for January 12, 2025
Blog
July 23, 2026
Adapting to OMIE’s (Portugal and Spain) 15-Minute Transition: How Granular Forecasts Can Help You Stay Ahead
Open article
Blog
December 11, 2025
What the beginning of daylight savings time means for peak pricing
Open article
Amperon presentation slide "How the Grid Changed in 2024" with aerial view of large-scale solar farm installation in agricultural setting at sunset
Blog
July 23, 2026
How the Grid Changed in 2024
Open article
Amperon recap slide for February 14-20 titled "Another cold week on the grid, another good week for Amperon's demand forecasts" with wind turbines in snowy landscape
Blog
July 23, 2026
Another cold week on the grid, another good week for Amperon’s demand forecasts
Open article
Blog
December 11, 2025
The Future of Western Power Markets: Why Implementing a Day-Ahead Market Matters
Open article
Blog
July 23, 2026
Harnessing the power of sub-hourly and hourly forecasts for wind assets
Open article
Blog
July 23, 2026
Forecasting for the Super Bowl: How much does the big game really affect demand?
Open article
Amperon promotional banner stating "33% more accurate in MISO" with blue gradient background and solar panels with wind turbines imagery
Blog
July 23, 2026
Best Demand and Net Demand Forecasting Calls to End 2024
Open article
Amperon slide featuring Punxsutawney Phil prediction reference titled "What Punxsutawney Phil's prediction for 6 more weeks of winter really means for the grid" with snowy groundhog image
Blog
July 23, 2026
What Punxsutawney Phil’s prediction for 6 more weeks of winter really means for the grid
Open article
Blog promotional graphic on navy background titled "New Blog: Why a hybrid regression/ML approach outperforms in energy forecasting" with layered visualization showing Linear Regression, Boosted Trees, and Additional secondary models
Blog
July 23, 2026
Why a hybrid regression/ML approach outperforms in energy forecasting
Open article
Blog
July 23, 2026
Europe 2024 Best Amperon Forecasting Calls and Trends to Watch
Open article
Title slide reading "Part 1: Inside Our Data: The Importance of Granular Weather Data" by Lily Bowdler from Amperon
Blog
July 23, 2026
Inside our Data: The Importance of Granular Weather Data
Open article
Bar chart showing 2025 Highest ISO Demand Levels So Far across four ISOs: ERCOT (68.9 GW), PJM (126.8 GW), MISO (97.9 GW), and SPP (43.1 GW)
Blog
July 23, 2026
Déjà vu? With one cold snap down, will we have a repeat of last MLK weekend?
Open article
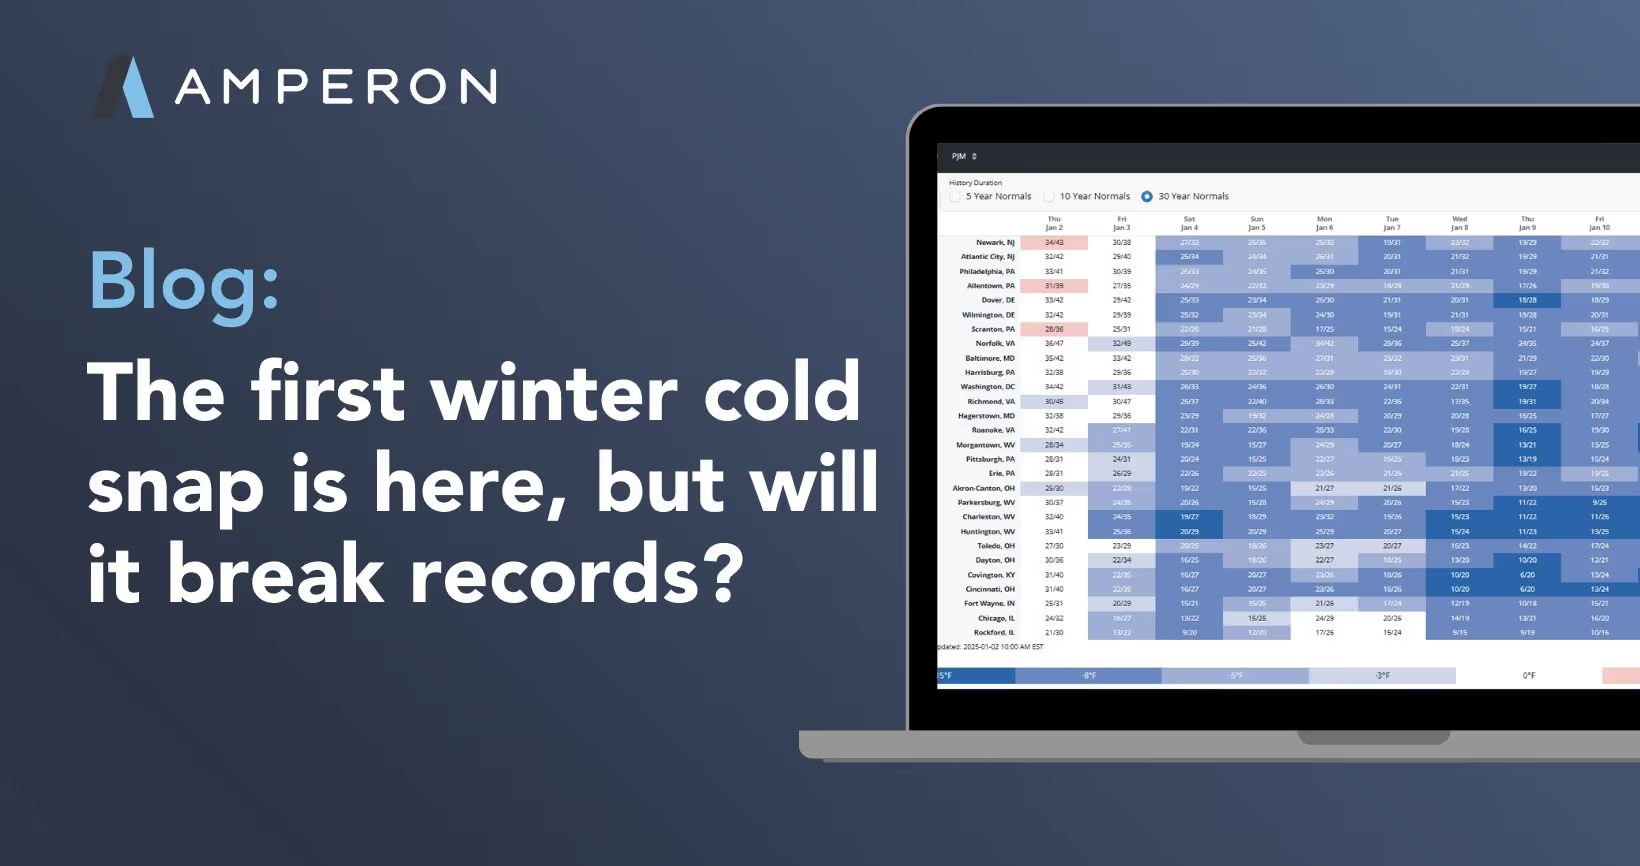
Blog promotional slide "The first winter cold snap is here, but will it break records?" with laptop displaying PJM weather data showing 5-year, 10-year, and 30-year normals for various cities
Blog
July 23, 2026
First winter cold snap is here, but will it break records?
Open article
Blog
July 23, 2026
Looking Back (and Ahead): A Year-end Q&A with Amperon CEO Sean Kelly
Open article
Line graph comparing Ireland Wind Generation forecasts for August 20-26, showing Actual Wind, Amperon Day Ahead Wind Forecast, and EirGrid Day Ahead Wind Forecast (duplicate of image 43)
Blog
July 23, 2026
How strong winds in Ireland left power market stakeholders exposed
Open article
Line graph of CAISO demand for Indigenous Peoples Day 2024 (October 11-14), showing Duck Curve pattern and comparing Amperon Day Ahead, ISO Day Ahead, and Actuals
Blog
July 23, 2026
Forecasting for the holidays: How holidays affect demand patterns
Open article
Blog
June 3, 2025
When tech buys nuclear, who wins?
Open article
Blog
November 18, 2025
Unlocking new standards in solar forecasting to maximize asset efficiency
Open article
Marketing graphic titled "What's Happening with Price Forecasting? A Q&A with Amperon CEO Sean Kelly" featuring professional headshot of Sean Kelly
Blog
November 18, 2025
What’s Happening with Price Forecasting? A Q&A with Amperon CEO Sean Kelly
Open article
Blog
November 18, 2025
Taking Advantage of Amperon’s Net Demand Forecast on Snowflake
Open article
Line graph showing ES (Spain) Demand for August 15 Feast of Assumption, with table comparing Peak Demand, Amperon APE, and ES APE percentages across four dates, plus lower panel showing electricity production and spot prices
Blog
November 18, 2025
2024 Energy Demand Trends: What Happened During 3 Recent EU Holidays
Open article
Blog
June 3, 2025
PJM Capacity Auction: Record Pricing and Delays
Open article
Multi-panel visualization showing ERCOT Demand for July 1-5, including line graphs comparing Amperon and ERCOT forecasts, data tables showing MAPE percentages for different dates, and gauge charts showing average MAPE (1.02% AMP, 1.69% ISO)
Blog
November 18, 2025
Amperon’s best energy forecasting calls for Summer 2024
Open article
Marketing text overlay on transmission tower background stating "Amperon's new price forecast tackles ERCOT's volatility and helps market participants mitigate risks"
Blog
November 18, 2025
Amperon’s new price forecast tackles ERCOT’s volatility and helps market participants mitigate risks
Open article
Marketing graphic announcing "Expanding Amperon's coverage on Snowflake" for Demand and Net Demand across North America and Europe ISO/TSOs, featuring screenshot of Snowflake marketplace interface
Blog
November 18, 2025
Expanding Amperon’s coverage on Snowflake: Demand and Net Demand for North America and Europe ISO/TSOs
Open article
Video thumbnail from webinar titled "Powering Data-Driven Decisions: Enhance Your Energy Trading Game with Amperon + Snowflake" featuring Amperon and Snowflake logos, dated September 26, 2024, with transmission tower image and video progress indicator show
Blog
November 18, 2025
Powering Data-Driven Decisions: Enhance your energy trading game with Amperon & Snowflake
Open article