


The July 2026 heat wave by the numbers
162.1 GW
PJM’s July 2 metered peak — a five-year record even with demand response suppressing it
+9 GW
Load across PJM and MISO beyond what temperature alone explains
+2.8 GW
Dominion’s weather-normalized load growth since 2021, accelerating to ~1 GW/yr
3 of 4
Markets where Amperon’s day-ahead beat the ISO’s own during the event
July 2026 peak load: it wasn’t just the weather
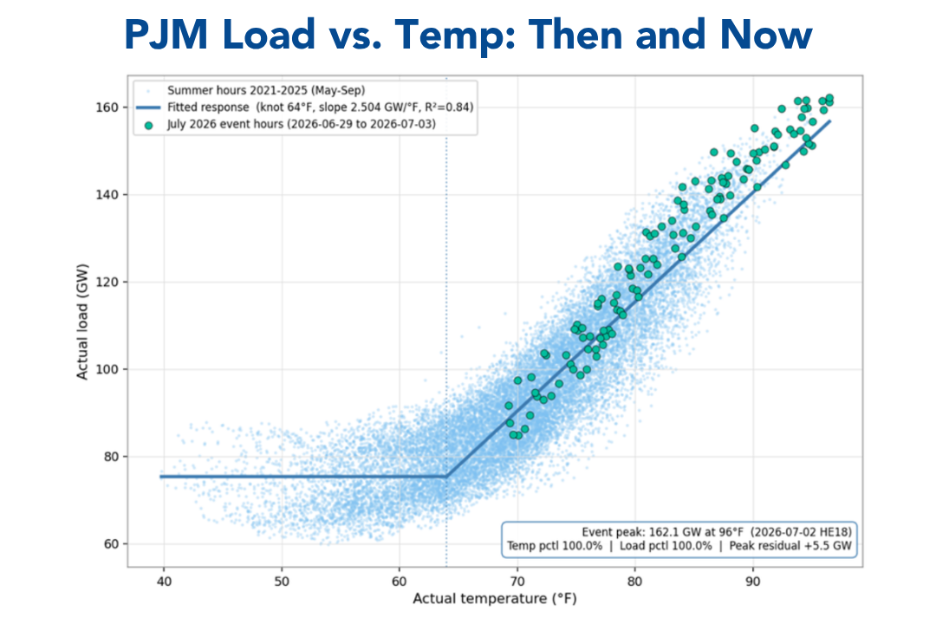
The first-order story is heat: every market’s load rides its temperature curve, and the temperatures were extraordinary. But fitting each market’s five-year load-versus-temperature relationship and asking what this event should have drawn splits the markets in two.
NYISO and ISO-NE sat exactly on their historical curves: a pure weather event. PJM ran +4.9 GW above its curve and MISO +4.2 GW above its own, totaling about 9 gigawatts of new underlying load. That’s roughly the load of a mid-sized state that’s not explained by temperature. In fact, MISO set a five-year load record at just 91 °F.
That gap is what structural demand growth looks like when a heat wave makes it visible. A grid that has quietly added always-on load all year suddenly needs that load plus record cooling demand on the same afternoon.
Finding the growth: Data Center Alley in the load data
Zoom into PJM and the growth is not broad; it is concentrated almost entirely in two zones. Dominion (Northern Virginia) and AEP (Ohio) account for 88% of PJM’s above-curve load, while seventeen other zones sat on their curves.
Dominion is the clearest structural growth signal we have measured in any U.S. market. Holding weather constant, its load has risen +2.8 GW since 2021, climbing every single summer, accelerating from roughly 700 MW per year to about 1 GW per year most recently.
And that growth has a fingerprint: it is flat across all 24 hours of the day; its overnight base is up 25% even as overnight temperatures fell; and its load factor keeps climbing. Air conditioning doesn’t do that. Always-on infrastructure does.
(Note: the data center attribution is an inference from load shape and location — the meter data can’t name the customer — but PJM’s own operators corroborated the pressure during this event, warning of possible curtailment of data centers and other large loads in the Dominion zone.)
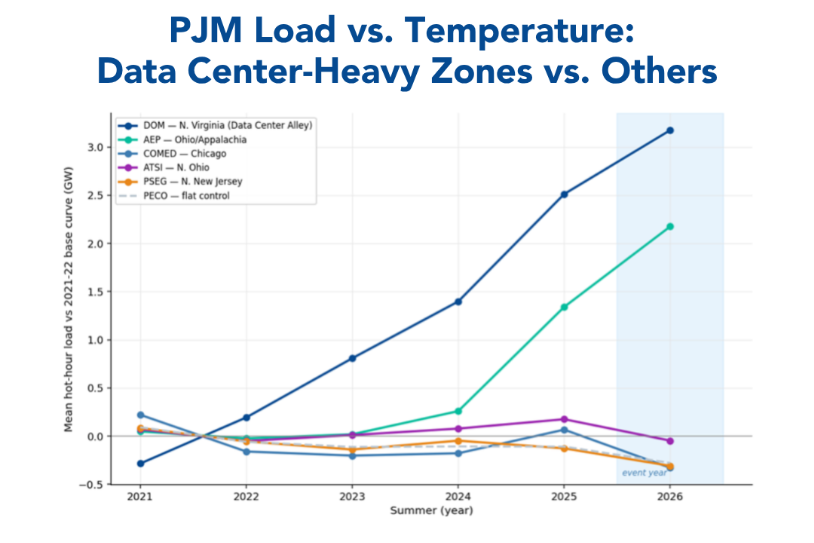
The same decomposition also catches the false positives. ComEd in Chicago looked elevated during the event, but at a fixed temperature its load is flat to declining. That distinction, between real structural growth versus a hot week spiking the numbers, is exactly what long-term planning and trading desks need to get right.
MISO’s surprise has a different shape: growth spread across five of six regions, tilted overnight (consistent with industrial load and electrification), with a footprint-wide midday dip carrying the signature of behind-the-meter solar. The same heat wave produced two very different growth stories, visible only because the data is granular enough to tell them apart.
The same heat wave produced two very different growth stories, visible only because the data is granular enough to tell them apart.
Amperon’s seasonal forecasts saw the heat wave 5 months out
A record-setting event on a structurally shifting grid is the hardest possible test for a load forecast. Fortunately, Amperon’s seasonal forecasts began picking up the heat wave months in advance.
Amperon's P90 seasonal forecast flagged the heat risk as far back as early February. In the Feb 6 vintage, the P90 PJM load forecast for July 1–2 was already sitting at ~150 GW, suggesting the tail risk of a significant heat event was present in the ensemble from the very start.
The biggest jump came around May 19. P90 for July 1–2 surged from ~150–151 GW (May 6) to ~161 GW (May 19), a jump of ~10 GW. P50 jumped as well. This is when the ECMWF weekly model took over and began resolving the weather pattern more concretely.
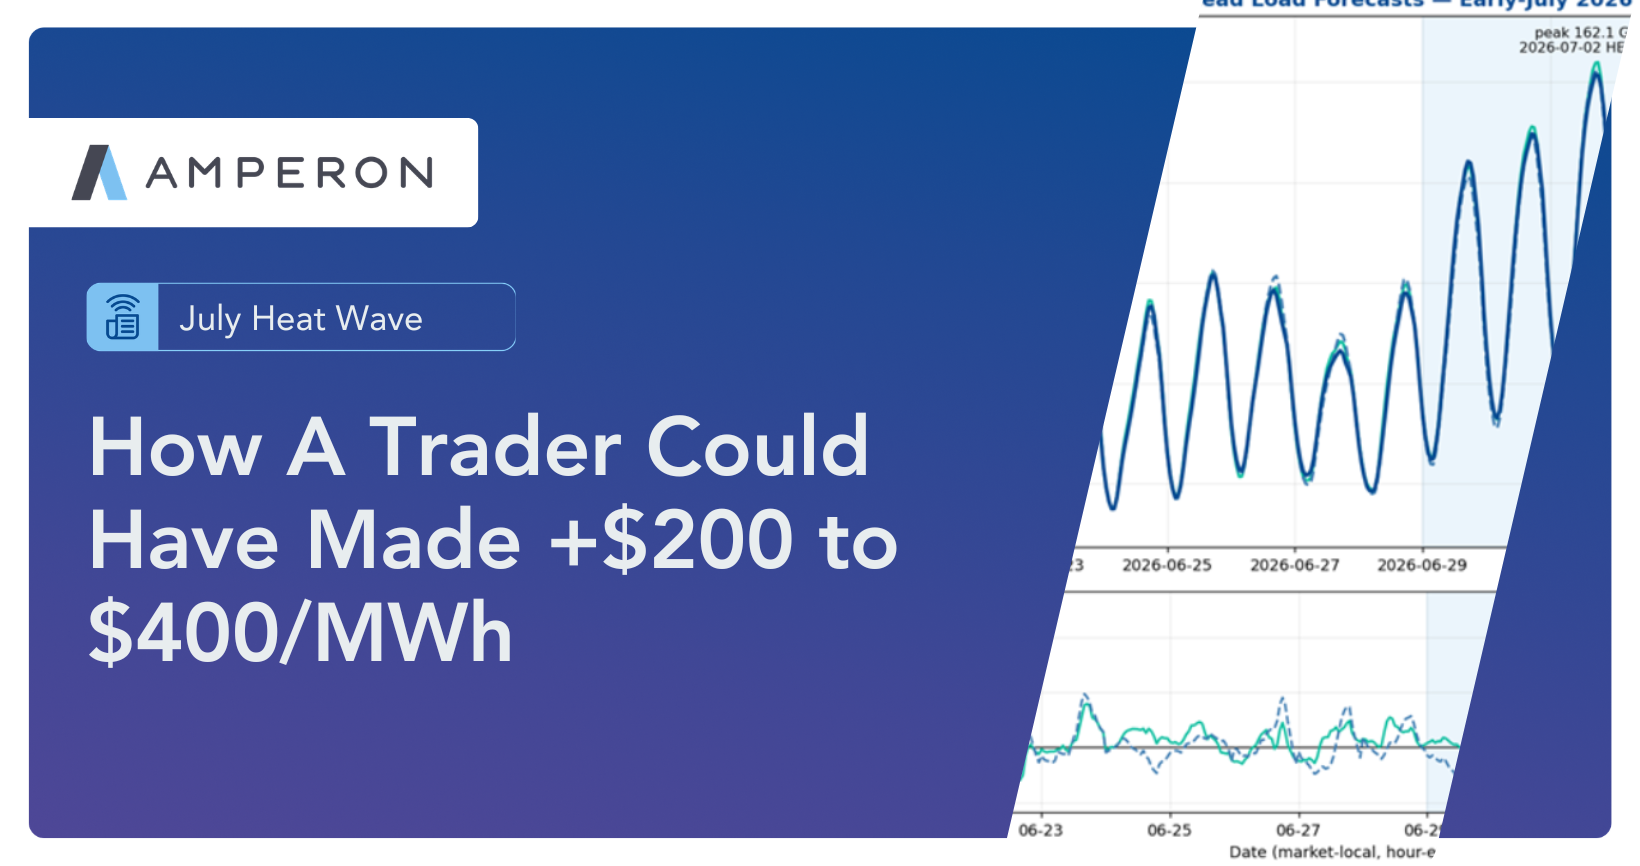
If a trader hedged the first week of July on May 19, they could have made +$200-$400/MWh. At that time, PJM Western Hub Day-Ahead Peak Daily Fixed Price Futures were sitting around $96 for July 1-3. In fact, prices did not start rising over $100 until June 15, right as the heat was starting to show up in the short-term model. Western Hub Day-Ahead Futures ended up settling anywhere from $330-$500.
If a trader hedged the first week of July on May 19, they could have made +$200-400/MWh.
Bottom line: Using the P90 as a leading indicator, the MTF had the July 1–2 heat wave on its radar roughly 5 months out. This means a risk-aware view using probabilistic forecasting would have flagged the July 2026 heat wave potential months earlier than the median forecast alone.
Amperon’s accuracy during the event
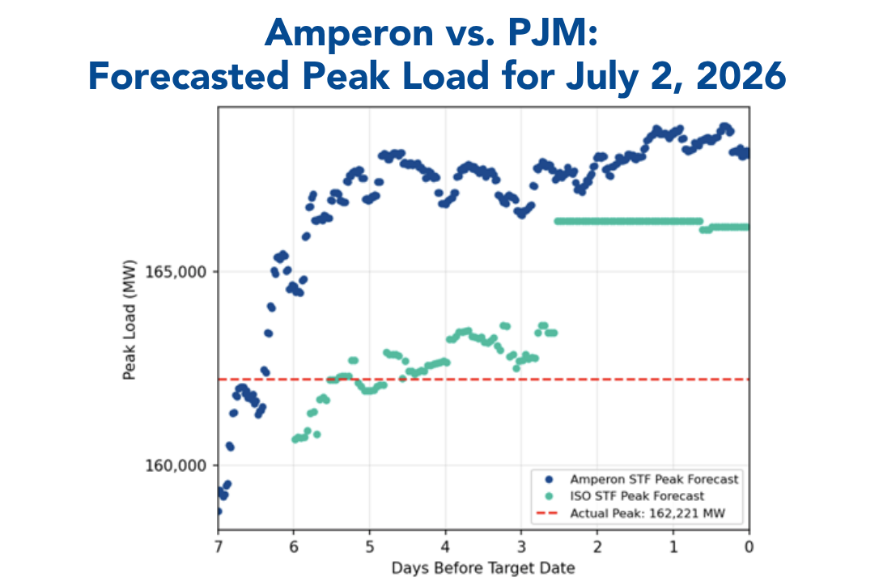
150 GW in PJM is a significant event, which Amperon’s P50 started confirming roughly 6 weeks out. 160 GW or more is a different story. That’s when the US' largest grid risks hitting a new all-time high.
Amperon’s short-term forecast began projecting PJM load over 160 GW roughly seven days out, giving users a slight edge over RTO forecasts. Both projections ended up high due to emergency demand response measures enacted by the grid operator.
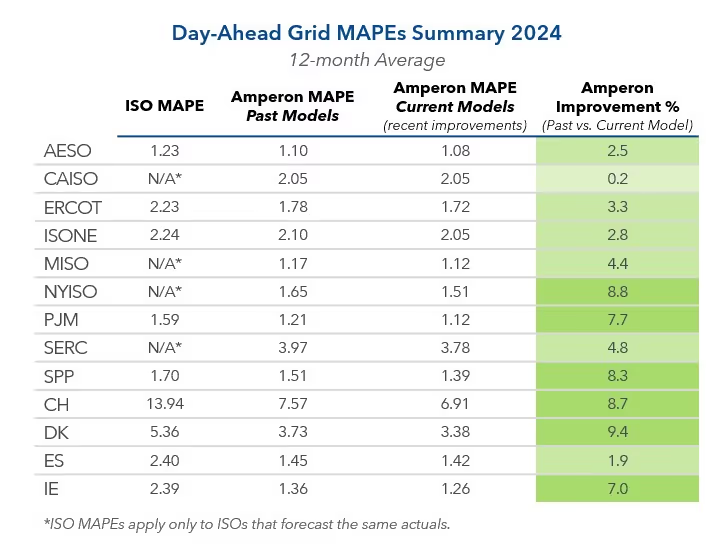
Over the event window, Amperon’s day-ahead forecast was more accurate than the ISO’s own in three of the four markets: 23% lower error in PJM, 16% in MISO, and 14% in NYISO, trailing only in ISO-NE.
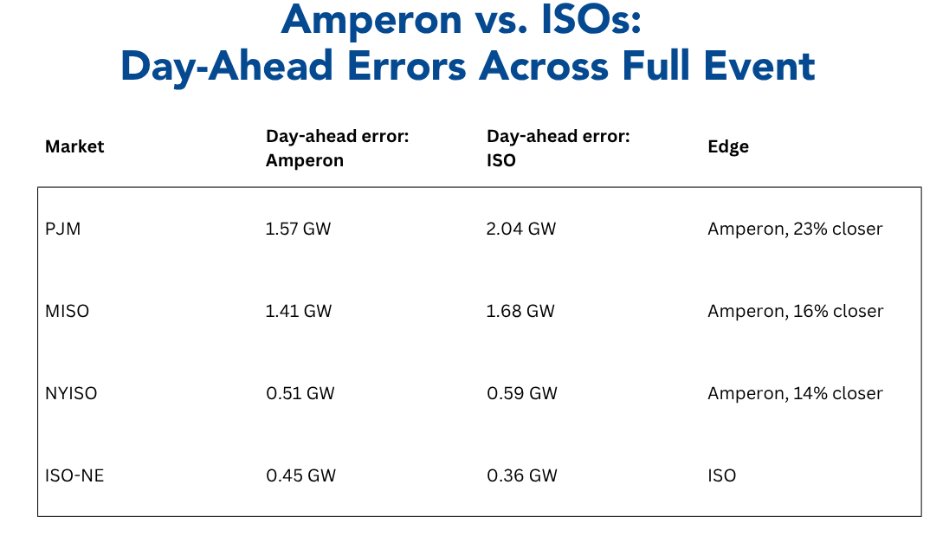
Just as important is what didn’t happen: nobody missed low. In every market, both forecasts came in at or above the metered peak — no operator was caught planning short. On the peak hour itself the apparent over-forecast is largely an artifact of demand response: PJM deployed emergency load reductions that shaved the metered number, so forecasts of demand naturally printed above the suppressed actual.
Why this event is a preview of the future
Data center and industrial load growth means the next heat wave will land on a bigger base. Dominion alone is growing at roughly 1 GW a year, driven by Data Center Alley. Records will keep falling at progressively less extreme temperatures, the way MISO’s just did at 91 °F. Forecasting that kind of grid requires seeing both layers at once: the weather on top and the structural growth underneath. That is what this analysis measures, and what Amperon’s forecasts priced in while the event was still in the day-ahead window.
Book a demo to learn more.
About this analysis: Based on Amperon’s hourly grid-load dataset: actual load, temperature, and day-ahead forecasts (Amperon and ISO-published) for every zone in PJM, MISO, NYISO and ISO-NE, July 2021 – July 2026. Growth attribution uses weather-normalized (fixed-temperature) year-over-year decomposition. The data-center and solar attributions are inferences from load shape and location, not customer-level facts. Peak-demand context from PJM’s July 3, 2026 operations update. Full technical report with methodology and per-zone detail available on request.

.svg)












































%20(3).png)
%20(2).png)
%20(1).png)






.png)


.avif)



.avif)
.avif)

.avif)

.avif)
%20(15).avif)

.avif)


.avif)

.avif)
.avif)



