

In Texas’ ERCOT power market, the transition from spring’s shoulder season into the hot summer is more than just a shift in weather — it’s a structural change in grid demand, generation flexibility, and price behavior. The way net demand evolves in response to temperature changes carries major implications for generators, traders, and forecasters alike.
Shoulder Season: Two Peaks, More Flexibility
March, April, and May mark the “shoulder season” — a period historically associated with lower overall demand. It’s also the time when many power plants take the opportunity to go offline for scheduled maintenance. Why? Because demand and net demand are subdued enough to allow for reduced available capacity. This can lead to some additional volatile prices. If you are interested more in prices during shoulder season, check out our blog on ERCOTs day-ahead morning ramp prices.
As illustrated in the first graph below (Hourly Demand by Daily Temperature), during the shoulder months — represented by the purple and blue lines (for average daily temps in the 50s and 60s °F) both demand and net demand exhibit a distinct two-peak structure:
- A morning peak around Hour Ending (HE) 6–9
- An evening peak around HE18-22
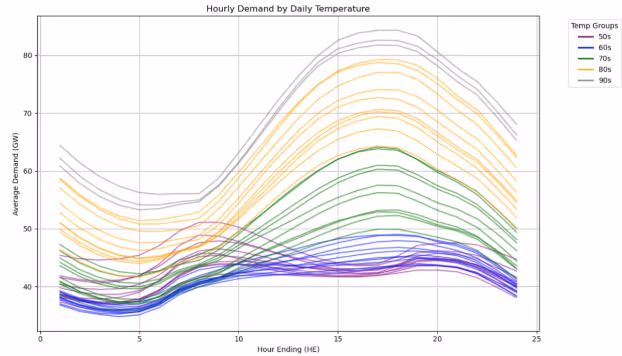
While neither of these peaks reaches summer levels, they create an interesting need for generation flexibility — plants must ramp up twice daily rather than managing around one sustained peak. These twin peaks can create subtle but important pricing events, especially when solar generation starts to ramp in late morning, helping to smooth the midday load valley.
Summer Shape: One Peak, Higher Stakes
As Texas warms and average daily temperatures climb into the 70s °F (green lines), 80s °F (orange lines), and 90s °F (gray lines), the structure of the net demand curve dramatically shifts. This transformation is visualized in the second graph (Hourly Net Demand by Daily Temperature):
- The morning peak fades
- The evening peak rises significantly in magnitude
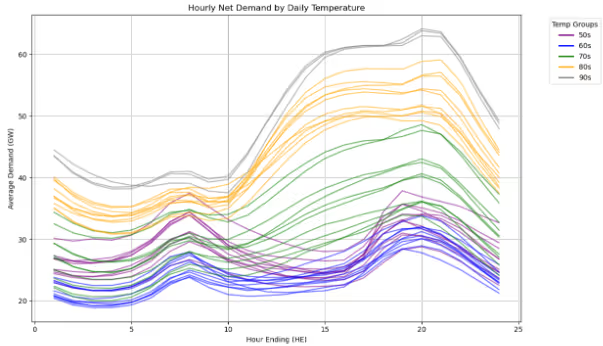
This evolution creates a single, sharp evening peak in the net demand curve — a classic summer pattern driven by increased cooling load and the sunset-related drop in solar generation. The green traces (70s) begin this transformation, while the orange (80s) and gray (90s) lines demonstrate the full force of summer demand. The average net demand during the evening hours average over 15GW than the morning hours. This average is consistent with temperatures hitting 74 °F and higher. So, when daily temperatures start to rise into the 70s, summer has started for the Texas grid. Analysis of hourly net demand data from 2021 through the present shows that this shift consistently occurs once average daily temperatures climb into the mid to high 70s — often beginning in late April to early May.
Historically, April averages hover in the high 60s to low 70s. This year, April temperatures have already averaged 70°F, suggesting the transition to summer demand shape is well underway. By May, average temperatures frequently rise into the high 70s and 80s, cementing the summer pattern.
Implications for Power Markets
As this temperature driven shift unfolds, we see important changes in both net demand and market behavior:
- Morning peak prices soften, with fewer price spikes or scarcity signals
- Evening peaks become more pronounced in both shape and price
- Overall demand and net demand increase, adding stress to generation and reserve margins
For market participants, this means forecast accuracy becomes critical, especially during the transition weeks. Generation stack positioning, commitment strategies, and hedging all need to account for when and how the demand curve will bend.
Stay Ahead of the Curve
At Amperon, we’ve been closely tracking this transition and forecasting when the demand shape will shift and what it means for prices. If you’re looking to better understand how demand and net demand will evolve heading into summer reach contact us here to schedule a trail or demo with Amperon. You will be able to see our demand and net demand forecast as well as our price forecast.
Watch the replay of our Summer Weather Outlook with Chief Meteorologist, Mark Shipham.
.avif)


.svg)


%20(3).png)
%20(2).png)
%20(1).png)


.png)


.avif)


.avif)

.avif)


.avif)


.avif)
%20(15).avif)

.avif)
%20(10).avif)

.avif)


.avif)

.avif)


.avif)


