Product Launch
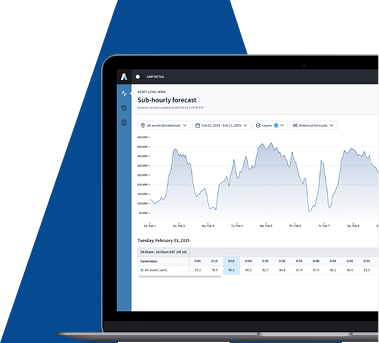
New Product Alert! Probabilistic Asset Solar and Wind Short-Term Forecasts
Learn More

Navigating the RTC+B Paradigm Shift

ERCOT’s RTC+B framework unlocks a new era of battery behavior. Energy retailers who understand how to play in this market will have a meaningful advantage.

Elliott Chorn
October 3, 2025
October 3, 2025

Summary

1
What RTC+B means for next-generation renewable procurement.
2
How the shift impacts cost, risk, and contract structures.
3
Why data accuracy and transparency now matter more than ever.
4
How RTC+B pushes markets closer to true 24/7 clean energy.

ERCOT is about to undergo one of the most significant market design shifts in its history. The move to Real-Time Co-Optimization + Batteries (RTC+B) isn’t just a technical upgrade—it’s a fundamental rethinking of how energy and reserves are priced, dispatched, and settled.

That “+B”? It’s not a footnote. It’s a paradigm shift that puts batteries at the center of real-time grid operations, price formation, and volatility management.  

If you’re a Retail Electric Provider (REP) without a battery strategy, whether directly or through DERs, VPPs, or demand response, you’re behind. Retailers who understand and leverage battery behavior will have a meaningful edge.

Let’s break down the changes, the risks, and the opportunities under the RTC+B market framework set to take effect on December 5, 2025.

What Is RTC+B?

Today, ERCOT handles energy and ancillary services separately: energy is dispatched in real time, while reserves are locked in day-ahead. RTC+B, in contrast, will co-optimize energy and reserves every five minutes.

The shift to RTC+B means that batteries, gas peakers, and flexible loads will be able to toggle between energy and reserve roles dynamically. ERCOT will simultaneously evaluate the cost and availability of both energy and reserves, dispatching resources to meet both needs in the most efficient way possible.

Batteries Step into the Spotlight

Batteries will no longer be treated as load when charging and generation when discharging. Under RTC+B, they’re treated as dynamic hybrid assets with a State of Charge (SoC) that ERCOT actively manages. Expect batteries to shape price curves, reliability, and real-time operations more than ever before.

This unlocks a new era of battery behavior:

  • Smoothing volatility by responding instantly to grid needs  
  • Shaping price curves based on SoC trends  
  • Daily arbitrage (charge low at noon, discharge into the evening ramp)  
  • Creating new “mini peaks” as widespread charging reshapes load curves  

In short, flexibility wins. If you’re a REP without a battery strategy—whether through DERs, VPPs, or demand response—you’re behind. Batteries will increasingly define real-time price formation and reliability.

Key Market Changes from RTC+B

1. Energy and Ancillaries Dispatched Together

Currently, ERCOT locks in ancillary services a day ahead and fine-tunes energy in real time. Under RTC+B, both will be co-optimized every five minutes. That means batteries, gas peakers, and even load resources can toggle between energy and reserves seamlessly. In short, flexibility wins.

2. ORDC Adders Are Out, ASDCs Are In

Scarcity pricing is getting a facelift. Instead of ORDC adders, ERCOT will use Ancillary Service Demand Curves (ASDCs) embedded directly into real-time dispatch. Prices will reflect both energy and reserve scarcity—simultaneously and in real time.

3. New Block Products in the Day-Ahead Market

ERCOT is introducing new products such as multi-hour block products (e.g., 3–7 p.m. ramp periods) in the Day-Ahead Market. This creates a major shift in how risk can be managed, as multi-hour blocks allow REPs to hedge volatility more effectively without juggling hourly bids.

What RTC+B Means for Retail Electric Providers

Volatility Isn’t Going Away—It’s Evolving

You may see fewer extreme price spikes from system surprises, but more intra-hour movement as batteries and reserves reposition every five minutes. Prices could swing significantly within a single hour, especially as batteries respond to shifting grid needs.

Hedging Will Require More Precision

Day-ahead and real-time prices may converge, shrinking arbitrage opportunities. But ancillary services will now reprice in real time—meaning your hedge could be tight on energy but misaligned on reserves. Block products could offer new tools for managing this risk.

Forecasting Will Become Even More Critical

In RTC+B, forecasting isn’t just about predicting demand—it’s about anticipating how the entire system will respond, minute by minute. With granular real-time pricing, every forecast error—on load, renewables, or battery behavior—has real-time financial consequences.

Forecasting errors don’t just lead to missed arbitrage; they can trigger real-time imbalance charges, misaligned hedges, and lost margin.

To navigate this, you’ll need:

  • Sharper load forecasts
  • Visibility into battery SoC and dispatch behavior  
  • Awareness of renewable swings and reserve scarcity signals  
Billing and Settlement Will Get More Complex

Expect new charge types and more granular settlement structures. If your systems can’t track RTC+B detail, you risk revenue leakage and compliance issues. Many current systems are built around hourly or day-ahead data, but RTC+B requires real-time settlement to avoid revenue leakage, trading inefficiencies, and compliance risks. ERCOT is still finalizing some elements, but your back office should already be planning.  

In short, RTC+B demands real-time situational awareness—and that starts with systems that can track and respond to the market’s new level of granularity.

A Time for Retailers to Modernize

RTC+B isn’t just a tweak—it’s a market evolution. For REPs, it’s a moment to modernize forecasting, trading strategy, and customer programs.

At Amperon, we’re already working with REPs on scenario modeling, forecast tuning, and trading system redesigns for RTC+B. The teams who start now will stay ahead. The ones who wait until late 2025 will be playing catch-up.

Key RTC+B Risks
  • More intra-hour price swings
  • Unexpected settlement charges
  • Forecast misses that hit harder  
  • System readiness gaps (e.g., billing, ETRM, analytics pipelines)  
  • Compliance missteps, especially if you're managing DERs or storage  
Key RTC+B Opportunities
  • Better hedging tools with block products and converging prices
  • Opportunities to monetize DERs and customer flexibility  
  • Potentially lower costs from ERCOT’s efficiency gains  
  • More competitive offers as forward curves tighten and premiums shrink

Contact us to audit your forecasts’ RTC+B readiness.

AI-driven Forecasting

Our advanced machine learning methodology delivers the accuracy you need to optimize operations and maximize profits.

  • 40K weather points from 4 vendors
  • 15-day short-term forecasts that update sub-hourly
  • Globally available
  • Leading UI/UX or API delivery
Book a demo

Want 3x more accurate forecasts? Let's talk.

Book a demo

Related articles

Left arrow icon for navigationRight arrow icon for navigation
Blog
August 12, 2026
Virtual Power Plants 101: How They Work and Why Forecasting Accuracy Matters
Open article
Blog
August 12, 2026
ERCOT 12CP: Why Texas is Moving from 4CP to Monthly Coincident Peaks
Open article
Blog
July 30, 2026
Amperon's 4CP Performance: June-July 2026
Open article
Blog
August 4, 2026
How Forecasting Helps C&I Operations Cut Energy Bills
Open article
Blog
August 4, 2026
Could Small Modular Reactors Close the Gap on AI’s Energy Demand?
Open article
Blog
July 24, 2026
7x Better than ERCOT: How Amperon Maintained Accuracy in Unusual Conditions
Open article
Blog
July 30, 2026
Data Center Energy Demand: The Top 5 Considerations for Power Traders
Open article
Blog
July 30, 2026
July 2026 Heat Event: How A Trader Could Have Made +$200 to $400/MWh
Open article
Blog
August 4, 2026
Amperon Integrates AI Weather Forecasting from ECMWF
Open article
Blog
July 24, 2026
Early July Heat Wave 2026: Forecast Models Signal Rising U.S. Power Demand
Open article
Blog
July 24, 2026
Transforming Seasonal Load Risk Planning for Utilities
Open article
Blog
July 23, 2026
Mexico's Grid Is Waking Up. Are Market Participants Ready?
Open article
Blog
July 23, 2026
The Top 3 European Grid Risks This Summer
Open article
Blog
July 23, 2026
The Top 3 US Grid Risks This Summer
Open article
Blog
July 24, 2026
Why Virginia Data Centers Matter to All of PJM
Open article
Blog
July 24, 2026
2026 US Summer Grid Preview
Open article
Blog
July 24, 2026
Two Perspectives on Net Load Forecasting
Open article
Blog
April 28, 2026
How Storms Compound Risk
Open article
Blog
July 23, 2026
The Art of Resource Adequacy
Open article
Blog
July 30, 2026
Can You Trade on a 3-Week Signal? Here's Proof.
Open article
Blog
July 23, 2026
DAME Brings New Costs to CAISO Market Participants on May 1
Open article
Blog
July 23, 2026
Why Data Centers are Moving Beyond Renewable Energy PPAs
Open article
Blog
July 23, 2026
When Batteries Break Your Forecast
Open article
Blog
March 26, 2026
The War in Iran and What It Means for Energy Forecasting
Open article
Blog
July 23, 2026
Ontario’s Market Renewal Program is a Major Success—Yet Volatility Remains
Open article
Blog
July 23, 2026
Seasonal Change Brings Forecasting Problems—Unless Your Model is Built for It
Open article
Blog
July 24, 2026
A Tale of Three Markets: The Winds of Change Blow Differently Across Europe
Open article
Blog
July 23, 2026
Quantifying Solar and Wind Uncertainty with Probabilistic Forecasting
Open article
Blog
July 23, 2026
The Future of Term Trading: Quantifying Tail Risk
Open article
Blog
July 23, 2026
Mitigating Curtailment Risk With Smarter Wind and Solar Forecasting
Open article
Blog
July 23, 2026
cnMAE: The Right Metric for Evaluating Solar & Wind Forecasts
Open article
Blog
July 23, 2026
How to Use Wind and Solar Forecasts: Net Load Forecasting and Day-Ahead Optimization
Open article
Blog
July 23, 2026
Uri vs. Fern: How ERCOT Learned to Bend Without Breaking
Open article
Blog
February 3, 2026
Before the Cold Hit: Early Demand Signals Behind January’s Arctic-Driven Power Price Surge
Open article
Blog
July 23, 2026
The Evolution of Energy Forecasting: From Deterministic to Probabilistic
Open article
Blog
August 12, 2026
Hedging Tail Risk: Term Traders Get a Powerful New Risk Management Tool
Open article
Blog
July 23, 2026
Sub-Hourly STF Improves Day-Ahead Positioning in the Era of Renewables
Open article
Blog
July 23, 2026
Behind PJM’s 800% Increase in Capacity Prices and Trump’s Emergency Auction Plan
Open article
Blog
July 23, 2026
Germany Proves Transmission is Just as Critical as Generation
Open article
Blog
July 23, 2026
How Amperon Won the Holidays
Open article
Blog
January 23, 2026
6 Grid Trends to Watch in 2026
Open article
Blog
August 13, 2026
Battery Energy Storage: ERCOT vs. CAISO
Open article
Blog
December 19, 2025
European Power Traders Finally Get One-Stop Forecasting
Open article
Blog
July 23, 2026
The Pacific Northwest Risks a 6 GW Shortfall This Winter
Open article
Blog
July 23, 2026
With Millions On the Line, Amperon Called Cold Snap 33 Days Out
Open article
Blog
July 23, 2026
Chilean Solar and Wind Asset Owners Face Hourly Reporting Under New Market Structure
Open article
Blog
July 23, 2026
Can PJM Keep Up with Exponential Load Growth?
Open article
Blog
August 12, 2026
US Winter Weather Outlook 2025–2026: Mild on Paper, Volatile in Practice
Open article
Blog
July 23, 2026
Ontario’s Day-Ahead Market is a Renewables Profitability Test
Open article
Blog
August 13, 2026
US Solar and Wind Curtailment Is Exploding
Open article
Blog
July 23, 2026
Navigating the RTC+B Paradigm Shift
Open article
Case study banner reading “Nailing MISO’s Fall 2025 Coincident Peak” with a computer displaying grid demand forecasts
Blog
July 23, 2026
Nailing MISO's Fall 2025 Coincident Peak: A Week-Ahead Perfect Call
Open article
Amperon MTF model visualization displaying market trends and forecasts
Blog
July 23, 2026
Unlocking Intelligent Term Trading and Seasonal Planning  
Open article
Blog post header with palm tree in hurricane winds asking Why Has This Hurricane Season Been So Quiet with Amperon branding
Blog
December 5, 2025
Why Has This Hurricane Season Been So Quiet?
Open article
Table showing parallel flow congestion scenarios across different energy markets including ISO/RTO, WEIM, WEIS, Markets+, and EDAM with scheduled delivery systems and mitigation strategies
Blog
July 23, 2026
CAISO Breaks the Transmission Hedge
Open article
Amperon blog post graphic asking High ERCOT Demand, Low Wind, and No Price Spike? with load forecast chart for August 18, 2025
Blog
August 12, 2026
High ERCOT Demand, Low Wind, and No Price Spike?
Open article
ISONE May hourly average load comparison chart showing data from 2023, 2024, and 2025 with peak loads around 13,534 MW at HE17-18
Blog
July 23, 2026
Electrification and BTM Solar: Reshaping Demand in ISO New England
Open article
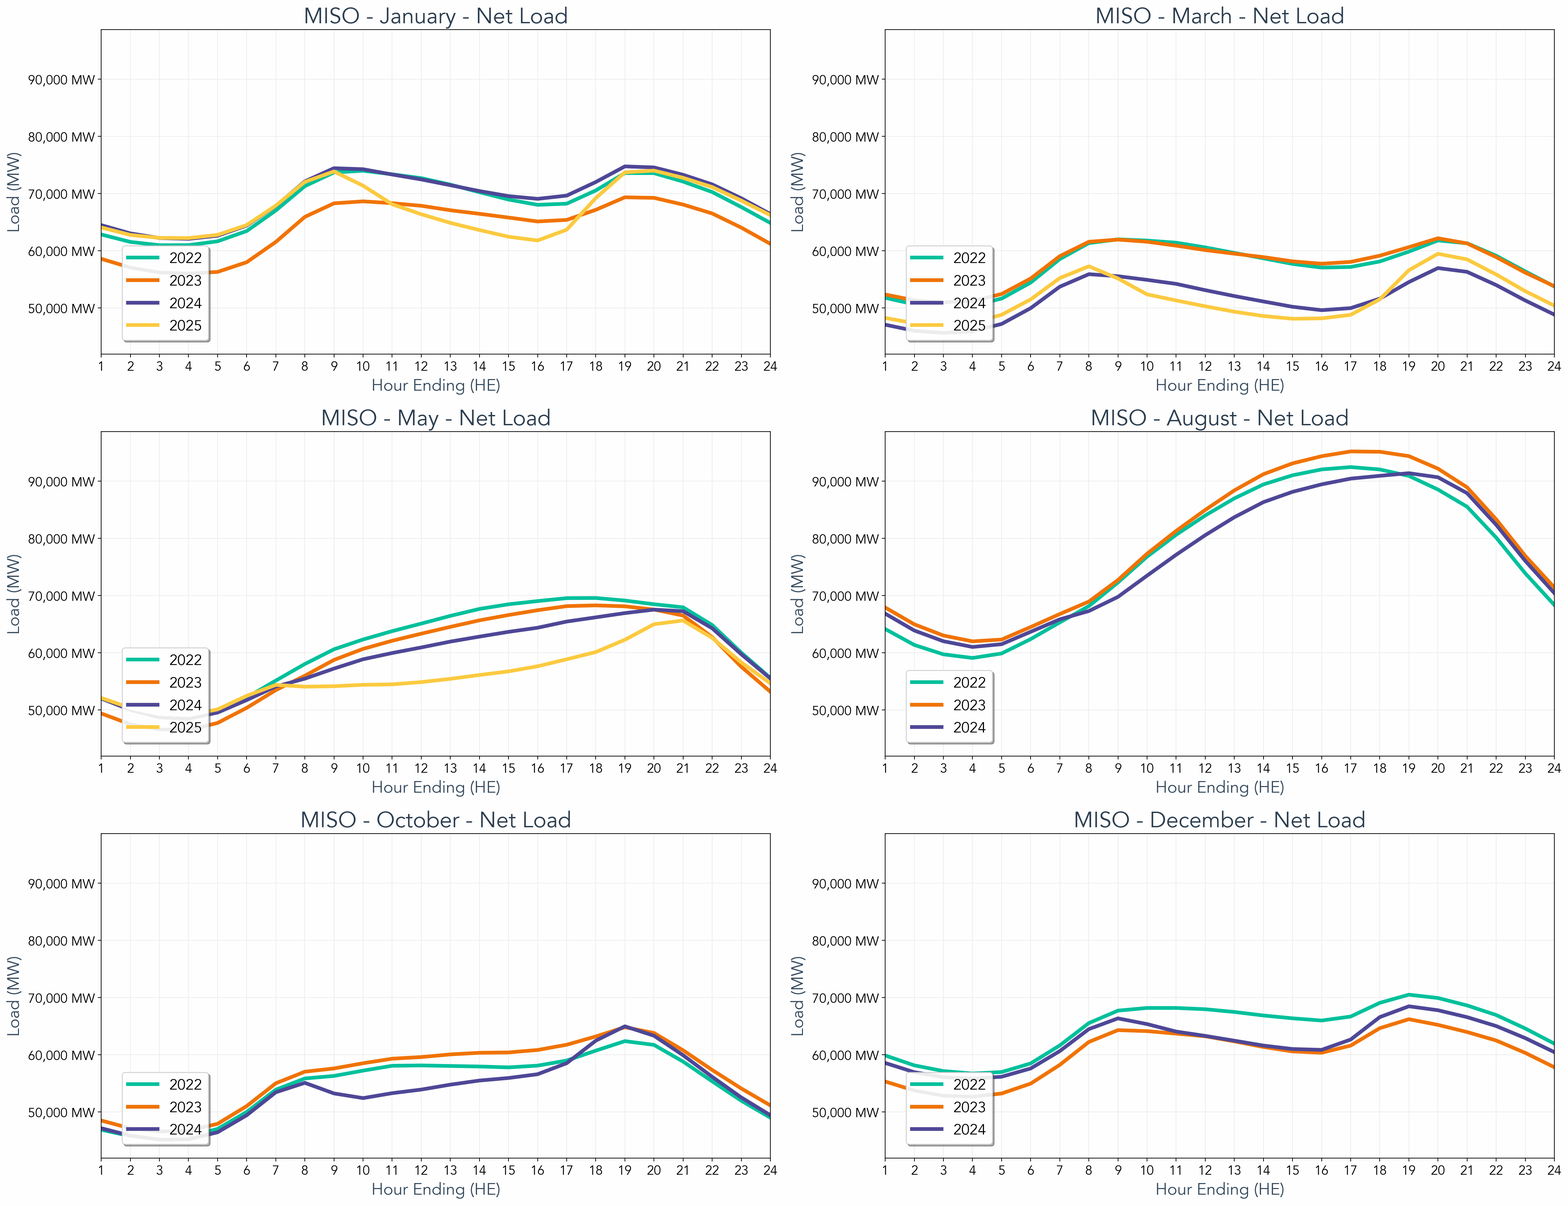
Line graph showing MISO Net Load from 2022-2025 comparing hourly load patterns ranging from 50,000 to 90,000 MW across 24-hour period
Blog
August 10, 2026
The Rise of the Duck Curve in ERCOT: A Shift in Net Demand Peak and the Future of Solar Power Integration
Open article
Amperon market analysis titled Where's the Chaos? ERCOT's Surprisingly Quiet Summer with curved line graph showing peak demand trends from 2022-2025
Blog
December 5, 2025
Where’s the Chaos? ERCOT’s Surprisingly Quiet Summer
Open article
Amperon forecasted load versus prediction time by weather vendor chart for PJM on June 24, 2025, showing settled demand at 158.2 GW with multiple vendor forecasts (ENS_1, NBM, DTN, AG2)

Blog
July 23, 2026
PJM Breaks 10-Year Peak Load Record — and Amperon Saw It Coming 7 Days Out
Open article
Blog
July 23, 2026
PJM Forecast: June 23–25 Heat Wave May Shatter Summer Expectations
Open article
Blog
July 23, 2026
ISONE’s First Heat Spike of Summer- and Amperon Nailed It
Open article
Amperon whitepaper cover titled Cost of Uncertainty: The Challenges and Value of Accurate Price Forecasting with download button, dated March 2025
Blog
July 23, 2026
Why Wholesale Electricity Prices are ESPECIALLY Volatile in Texas
Open article
Blog
July 23, 2026
Powering Profitable Growth for Retail Electricity Providers: Turn Load Forecasting into Your Competitive Edge
Open article
Blog
August 12, 2026
What Is 4CP? ERCOT's Coincident Peak Program Explained
Open article
Amperon promotional banner announcing sub-hourly grid forecasts for European TSOs now available, featuring transmission tower with geometric orange and blue design elements
Blog
August 12, 2026
Europe’s Shift to 15-Minute Power Markets: How Amperon Helps You Prepare for Market Evolution
Open article
Amperon blog post graphic titled "The Shape Shift: How Texas Net Demand Transitions from Shoulder to Summer" with wind turbine image
Blog
July 23, 2026
The Shape Shift: How Texas Net Demand Transitions from Shoulder to Summer
Open article
Amperon presentation slide titled "ERCOT's Evolving Price Dynamics 2021-2024 Analysis" with sunset transmission tower image
Blog
July 30, 2026
ERCOT’s Evolving Price Dynamics [2021-2024 Analysis]
Open article
A promotional image announcing the introduction of real-time grid price forecasts now live in ERCOT, featuring Amperon branding
Blog
July 23, 2026
Amperon Expands Forecasting Capabilities with Real-Time Price Predictions in ERCOT
Open article
Blog
July 23, 2026
MISO’s VOLL Change Could Reshape Scarcity Pricing and Reliability Signals
Open article
Blog
July 23, 2026
Why Behind-the-meter Solar Complicates Spring Forecasting
Open article
Comparison table showing solar and wind forecasting capabilities across Machine Learning, Physics-based, and Amperon (ML+PB) approaches for partial asset metadata, soiling, equipment degradation, biased weather, and curtailment
Blog
August 13, 2026
How to Forecast Energy Generation for Wind or Solar Assets
Open article
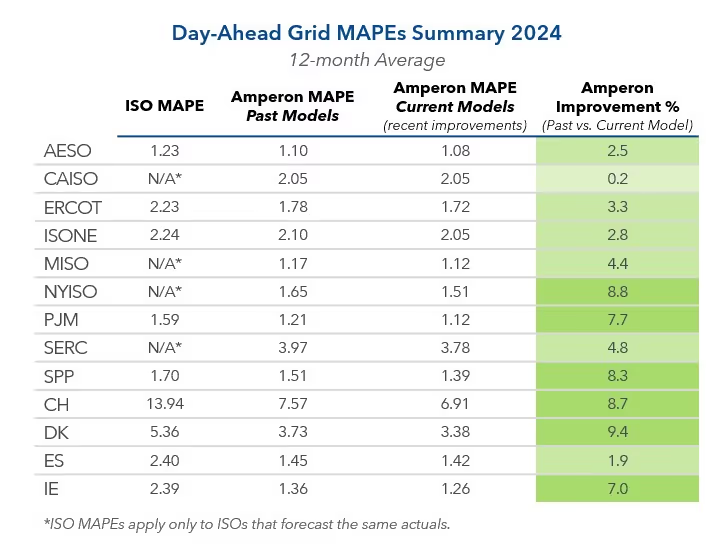
Day-ahead grid MAPE summary table for 2024 showing 12-month average comparison of ISO MAPE, Amperon MAPE past models, current models, and improvement percentages across multiple ISOs (AESO, CAISO, ERCOT, ISONE, MISO, NYISO, PJM, SERC, SPP, CH, DK, ES, IE)
Blog
July 23, 2026
Always Innovating: Amperon’s New Techniques to Improve Energy Forecasting
Open article
Amperon recap slide for April 7 titled "Why prices in ERCOT soared to $4000 per MW" with pastoral field landscape at golden hour
Blog
July 23, 2026
High Net Demand and Outages Caused Recent Price Spike in ERCOT
Open article
Amperon ebook promotional banner "Price Forecasting: Cost of Uncertainty - The Challenges and Value of Accurate Price Forecasting" with free ebook download button on gradient blue-green background
Blog
July 23, 2026
Are ERCOT’s morning ramp DA prices really higher than summer?
Open article
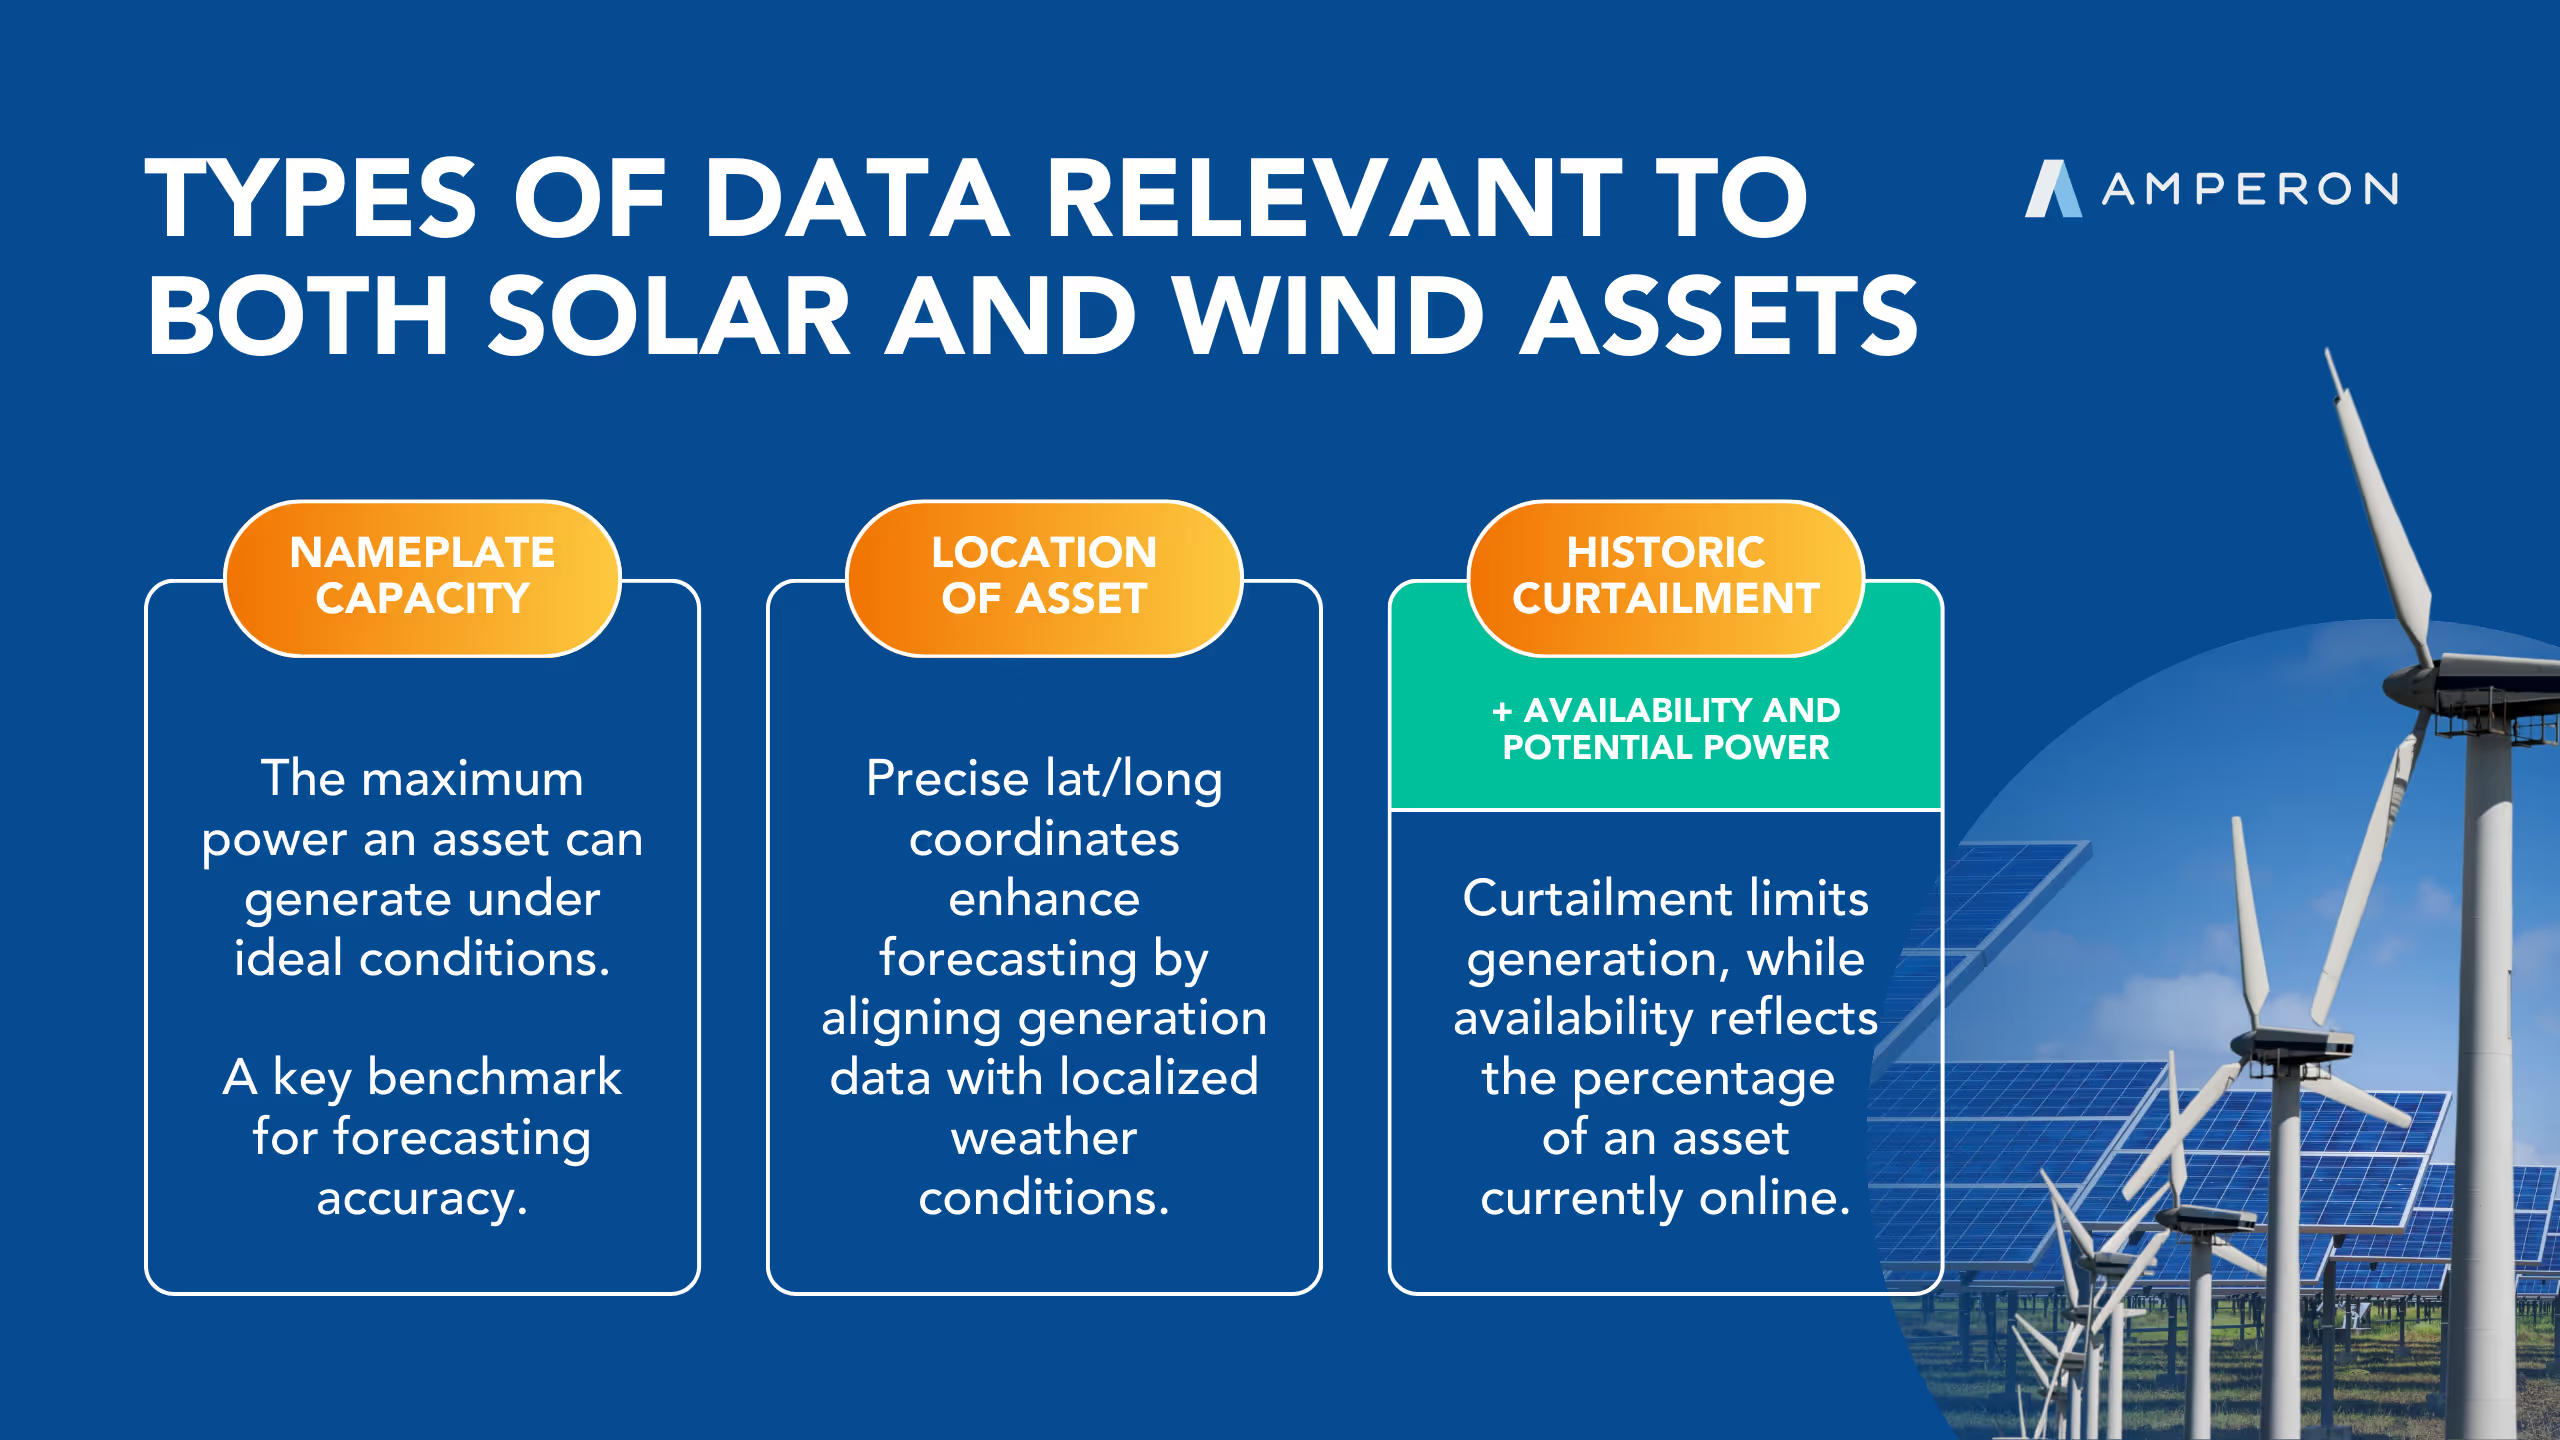
Infographic titled "Types of Data Relevant to Both Solar and Wind Assets" showing three categories: Nameplate Capacity, Location of Asset, and Historic Curtailment with wind turbines and solar panels imagery
Blog
July 23, 2026
Inside our Data: Intro to Renewable Asset Data
Open article
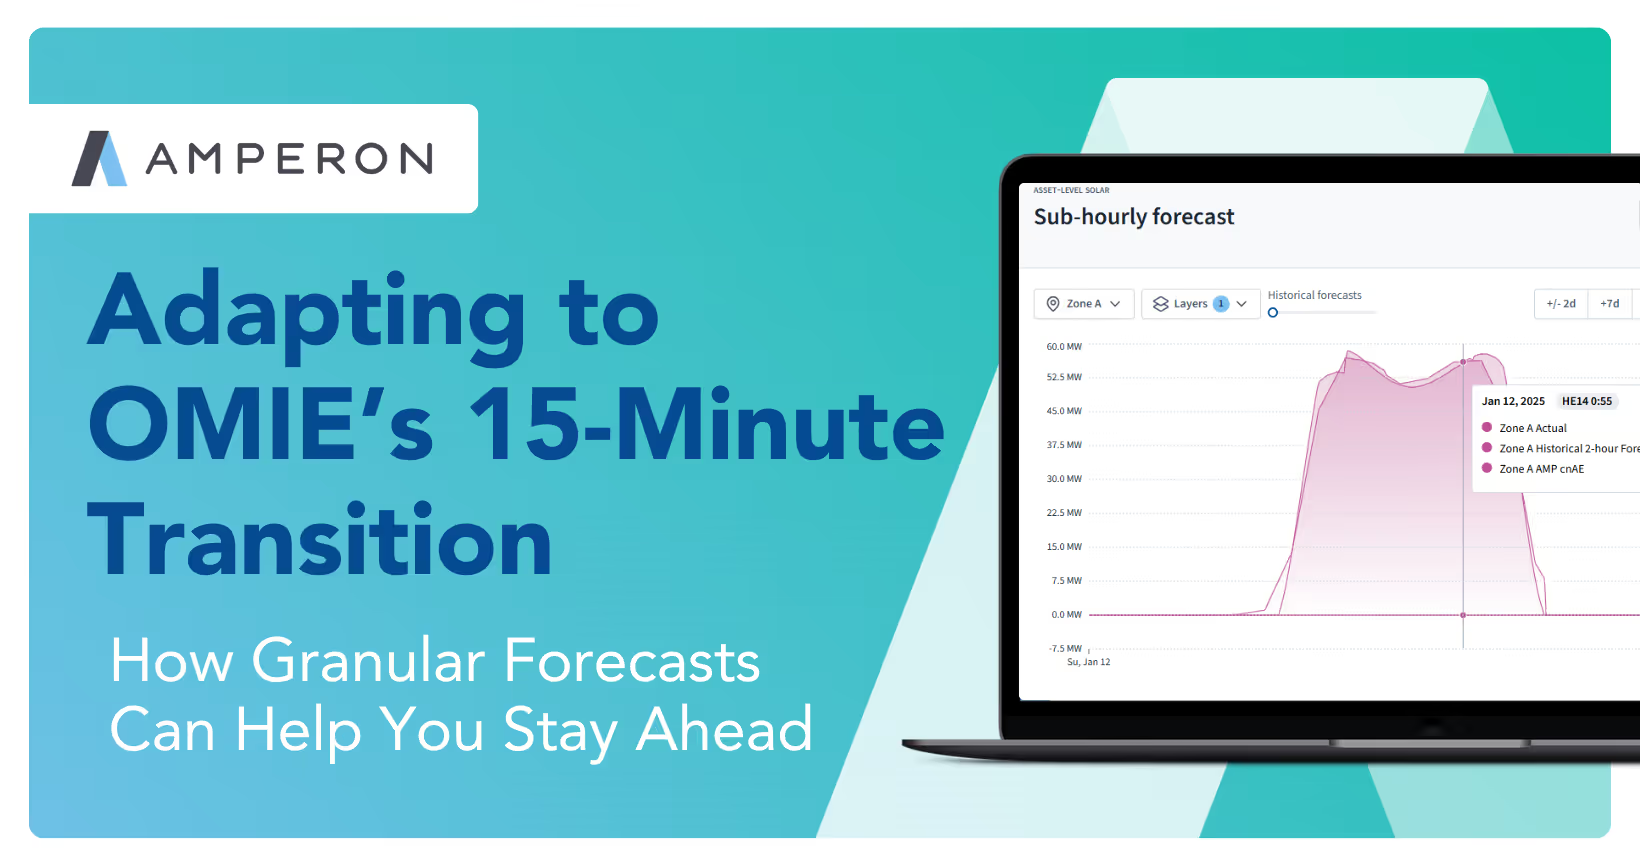
Amperon promotional slide "Adapting to OMIE's 15-Minute Transition: How Granular Forecasts Can Help You Stay Ahead" with laptop showing asset-level solar sub-hourly forecast for January 12, 2025
Blog
July 23, 2026
Adapting to OMIE’s (Portugal and Spain) 15-Minute Transition: How Granular Forecasts Can Help You Stay Ahead
Open article
Blog
December 11, 2025
What the beginning of daylight savings time means for peak pricing
Open article
Amperon presentation slide "How the Grid Changed in 2024" with aerial view of large-scale solar farm installation in agricultural setting at sunset
Blog
July 23, 2026
How the Grid Changed in 2024
Open article
Amperon recap slide for February 14-20 titled "Another cold week on the grid, another good week for Amperon's demand forecasts" with wind turbines in snowy landscape
Blog
July 23, 2026
Another cold week on the grid, another good week for Amperon’s demand forecasts
Open article
Blog
December 11, 2025
The Future of Western Power Markets: Why Implementing a Day-Ahead Market Matters
Open article
Blog
July 23, 2026
Harnessing the power of sub-hourly and hourly forecasts for wind assets
Open article
Blog
July 23, 2026
Forecasting for the Super Bowl: How much does the big game really affect demand?
Open article
Amperon promotional banner stating "33% more accurate in MISO" with blue gradient background and solar panels with wind turbines imagery
Blog
July 23, 2026
Best Demand and Net Demand Forecasting Calls to End 2024
Open article
Amperon slide featuring Punxsutawney Phil prediction reference titled "What Punxsutawney Phil's prediction for 6 more weeks of winter really means for the grid" with snowy groundhog image
Blog
July 23, 2026
What Punxsutawney Phil’s prediction for 6 more weeks of winter really means for the grid
Open article
Blog promotional graphic on navy background titled "New Blog: Why a hybrid regression/ML approach outperforms in energy forecasting" with layered visualization showing Linear Regression, Boosted Trees, and Additional secondary models
Blog
July 23, 2026
Why a hybrid regression/ML approach outperforms in energy forecasting
Open article
Blog
July 23, 2026
Europe 2024 Best Amperon Forecasting Calls and Trends to Watch
Open article
Title slide reading "Part 1: Inside Our Data: The Importance of Granular Weather Data" by Lily Bowdler from Amperon
Blog
July 23, 2026
Inside our Data: The Importance of Granular Weather Data
Open article
Bar chart showing 2025 Highest ISO Demand Levels So Far across four ISOs: ERCOT (68.9 GW), PJM (126.8 GW), MISO (97.9 GW), and SPP (43.1 GW)
Blog
July 23, 2026
Déjà vu? With one cold snap down, will we have a repeat of last MLK weekend?
Open article
Blog promotional slide "The first winter cold snap is here, but will it break records?" with laptop displaying PJM weather data showing 5-year, 10-year, and 30-year normals for various cities
Blog
July 23, 2026
First winter cold snap is here, but will it break records?
Open article
Blog
July 23, 2026
Looking Back (and Ahead): A Year-end Q&A with Amperon CEO Sean Kelly
Open article
Line graph comparing Ireland Wind Generation forecasts for August 20-26, showing Actual Wind, Amperon Day Ahead Wind Forecast, and EirGrid Day Ahead Wind Forecast (duplicate of image 43)
Blog
July 23, 2026
How strong winds in Ireland left power market stakeholders exposed
Open article
Line graph of CAISO demand for Indigenous Peoples Day 2024 (October 11-14), showing Duck Curve pattern and comparing Amperon Day Ahead, ISO Day Ahead, and Actuals
Blog
July 23, 2026
Forecasting for the holidays: How holidays affect demand patterns
Open article
Blog
June 3, 2025
When tech buys nuclear, who wins?
Open article
Blog
November 18, 2025
Unlocking new standards in solar forecasting to maximize asset efficiency
Open article
Marketing graphic titled "What's Happening with Price Forecasting? A Q&A with Amperon CEO Sean Kelly" featuring professional headshot of Sean Kelly
Blog
November 18, 2025
What’s Happening with Price Forecasting? A Q&A with Amperon CEO Sean Kelly
Open article
Blog
November 18, 2025
Taking Advantage of Amperon’s Net Demand Forecast on Snowflake
Open article
Line graph showing ES (Spain) Demand for August 15 Feast of Assumption, with table comparing Peak Demand, Amperon APE, and ES APE percentages across four dates, plus lower panel showing electricity production and spot prices
Blog
November 18, 2025
2024 Energy Demand Trends: What Happened During 3 Recent EU Holidays
Open article
Blog
June 3, 2025
PJM Capacity Auction: Record Pricing and Delays
Open article
Multi-panel visualization showing ERCOT Demand for July 1-5, including line graphs comparing Amperon and ERCOT forecasts, data tables showing MAPE percentages for different dates, and gauge charts showing average MAPE (1.02% AMP, 1.69% ISO)
Blog
November 18, 2025
Amperon’s best energy forecasting calls for Summer 2024
Open article