Product Launch
New Product Alert! Probabilistic Asset Solar and Wind Short-Term Forecasts
Learn More

Summer 2026 in Review: Record Heat, Record Power Demand

A Super El Niño brought drought, new ERCOT demand highs, and Europe's hottest summer on record. See how power markets responded and how Amperon performed.

Arianna Goldstein
September 29, 2026
September 25, 2026

Summary

1
ERCOT set a new all-time peak demand record of 91.1 GW even without the extreme temperatures seen in prior record-setting years.
2
Relentless heat in Europe left residents sweltering, which will continue to push air conditioning demand higher in the future.
3
Markets with significant solar and battery penetration weathered summer heat more smoothly, highlighting how storage is reshaping price risk and grid reliability.
4

What a summer. A massive heat ridge parked itself over the Four Corners and Texas for weeks, the East flipped between cool stretches and brutal heat, and Europe had its hottest summer on record. Even the tropics had a split personality: the Atlantic stayed completely quiet while the Pacific is still churning out a record season.

For traders, that meant volatility almost everywhere you looked. Here's how the season played out across the major markets, where demand hit its limits, and how our forecasts held up when it mattered most.

The Big Picture: Heat, Drought, a Building El Niño, and a Quiet Atlantic

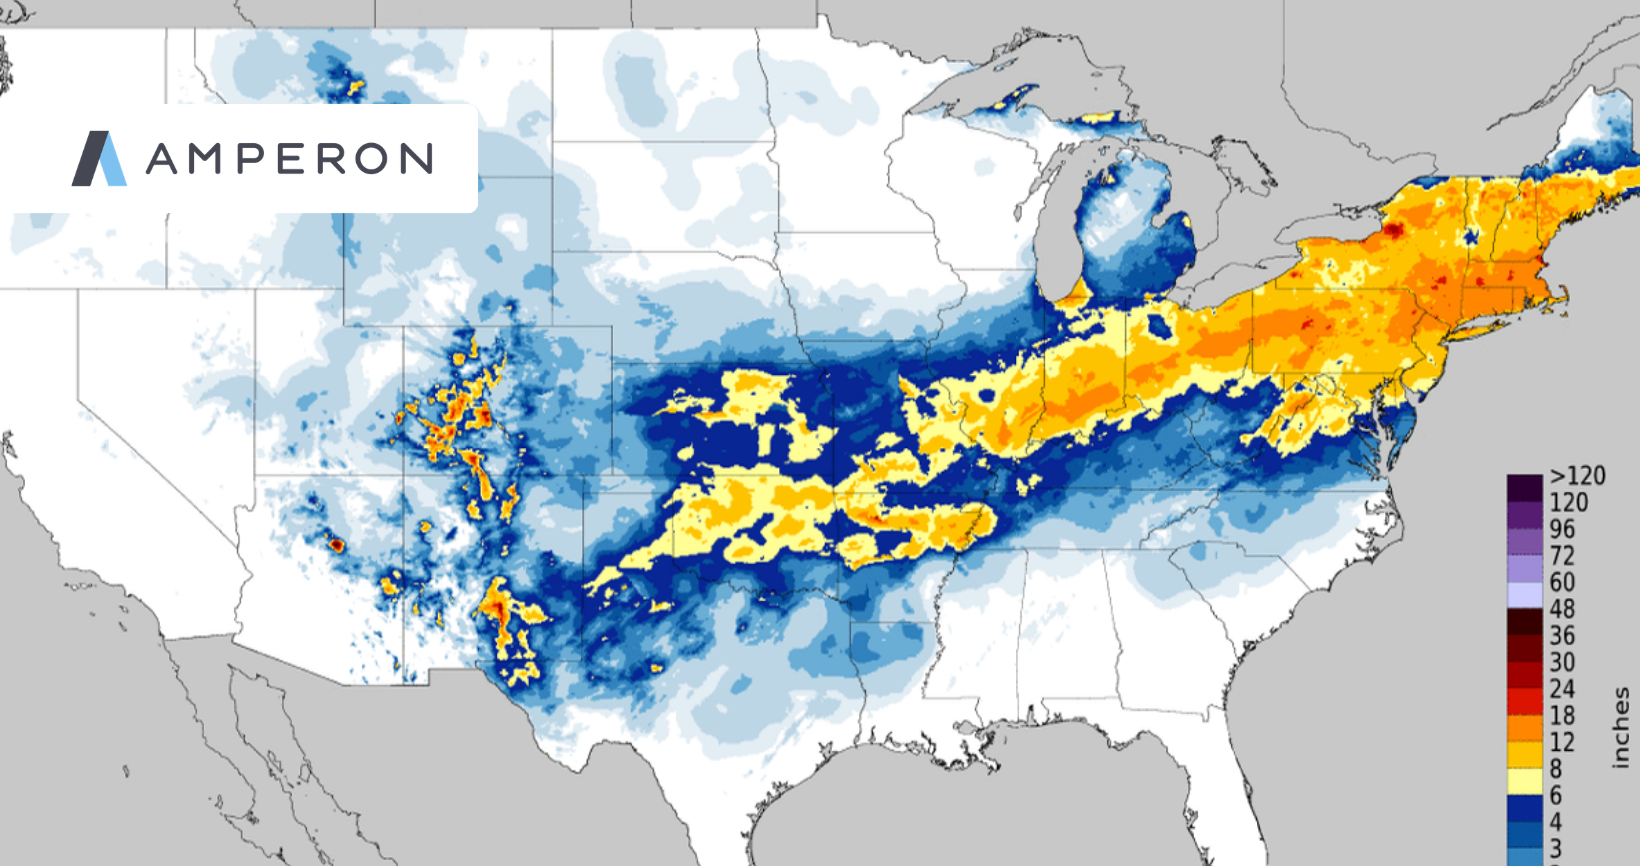
The West and South ran hot all summer thanks to a persistent ridge over the Four Corners and Texas. Out East, it was a different story. A few weeks ran below normal, then 1 to 2 weeks came in 15-20°F above normal. Those swings are exactly what make or break a trading week.

Drought is also a major factor heading into fall, especially across the southern Plains, the upper West, and the Four Corners. On top of that, El Niño strengthened all summer and has now reached "Super El Niño" territory. That same pattern helped keep the Atlantic shut down, with strong wind shear stopping storms from organizing, while the Pacific had one of its most active seasons ever. Could this Super El Niño lead to a warmer winter overall?

ERCOT: A New Peak Demand Record

ERCOT set a new all-time peak demand record of 91.1 GW on July 22, and August followed with a handful of days above 90 GW. Interestingly, temperatures weren't dramatically and consistently hot like what we saw the summer of 2022, but we still saw a typical Texas summer, which tells you how much structural demand growth is driving these peaks.

Even so, prices stayed relatively calm. Solar carried the grid through the hottest hours, and batteries picked up the evening ramp as the sun went down, right when the grid used to get into trouble.

Amperon’s day-ahead forecast settled with a 0.18% APE at the peak hour, HE18, where we set the new demand record, compared to ERCOT’s 2.31% APE. ERCOT was forecasting a much stronger falloff after HE17 than what actually occurred, leaving traders short if they were solely reliant on ERCOT’s day-ahead forecast on the ISO’s biggest day ever!  

PJM: The Record That Almost Was

PJM saw its hottest temperatures of the summer during the week of July 4th, with highs reaching above 100 and "feels like" temperatures reaching as high as 115F in some regions due to the humidity.

PJM peak demand hit 162.2 GW, and it could have broken the all-time record of 165.56 GW if demand response and curtailments hadn't come into play. Accounting for 3-5 GW of DR and curtailments, the underlying demand was well above what showed up in the final number.

Unlike ERCOT and CAISO, PJM doesn't have a large fleet of renewables or batteries to lean on, and it showed in real-time prices. Around 8pm on July 2 when real time prices were peaking the most, less than 5% of PJM’s supply came from wind, solar, batteries, and hydro combined.  

With data center demand growing fast and generation additions not keeping up, this is a market to watch closely. We have already seen years of historic capacity pricing for PJM. This will continue as long as we see this load growth trend keep up.  

MISO and SPP

This summer, MISO demand reached 125.1 GW on June 30, the highest demand we have seen in at least 10 years and right in line with MISO’s predicted peak. Amperon’s APE at HE17, the peak demand hour, was 0.70% compared to the ISO’s 0.92%. SPP also broke its 2023 demand record with load reaching 57.6 GW on July 27.  

Demand growth in these regions is also very prominent, but the supply stack is also growing.This summer, MISO nearly doubled its solar capacity year over year, which led to MISO starting to change how it manages steep net demand shifts. The ISO still saw very negative DARTs across the summer’s demand peak on June 30. With the duck curve deepening, MISO is starting to look a lot more like CAISO and ERCOT.

Parts of MISO Central also saw a record-breaking amount of severe weather this summer. Illinois recorded its most tornadoes in a year on record, with a large concentration of them in June. While SPP is typically considered the heart of Tornado Alley, this summer was a different story.

Classic California Late-Summer Heat

This summer ran warmer than the last few in California. In true California fashion, the biggest heat arrived late, with demand reaching 49.9 GW on September 9. That's the highest demand CAISO has seen since 2022, and it was within striking distance of the 52 GW record.

Solar and batteries played a huge role in keeping the grid stable through that event. While natural gas plants were supplying about 45% of supply during the peak demand hour of the day, solar generation was still going strong, providing about 20% of power while we started to see batteries ramp up at this time to capture 10% of load.  

At the peak price hours, when we saw about 15 minutes of negative DARTs, batteries supplied a record-breaking 22% of grid demand, while wind and hydro contributed another ~10%.

Europe: The Hottest Summer on Record

The EU and the UK saw an incredible number of 90-100°F (32-38°C+) days this summer. Europe got an early warning in May, when a heat dome shattered records in several countries. London hit 35.1°C (95.2°F) on May 26, beating its previous May record by 2.3°C.  

And that was just the start. By mid-August, Western Europe was in its fifth heat wave of the season, with temperatures well above 40°C (104°F) across a wide area. Bordeaux broke its all-time high three days in a row in June, peaking at 42.5°C on June 24, and Slovakia set new national records for both daytime and nighttime highs in August. The combined June and July temperatures in Western Europe were the highest on record.

What made this summer especially tough for power markets was how relentless the heat was (just as Amperon predicted). Heat waves lasted days and sometimes weeks, and temperatures stayed high overnight, so there was very little relief. The heat also worsened a drought that has gripped the region for months, pushing major rivers to record-low levels and disrupting water and power supplies along with transportation routes.

It's worth noting how different Europe's demand picture is from the U.S. Only about 23% of European homes have air conditioning, compared to 90% in the U.S., so the grid's response to heat looks very different—but that gap is likely to keep shrinking as more cooling gets installed.

Tropics: Quiet Atlantic, Record Pacific

There were minimal hurricanes in the Atlantic this season: Atlantic storms are only at letter G, while the Pacific is already at P! Strong wind shear kept Atlantic storms from organizing, which was great news for Gulf Coast gas and power infrastructure.  

The Pacific, on the other hand, had a record season. So far, there have already been 6 major hurricanes, with Major Hurricane Polo being one of the strongest-ever storms in the Eastern Pacific. This compares to just ~4 major Pacific hurricanes in an average year, and we are not out of the woods yet, with Pacific sea surface temperatures still sitting far above normal.  

Key Takeaways for Traders

  1. Demand records are coming from growth, not just heat. ERCOT set a record without extreme temperature anomalies.  
  1. Storage changes the evening risk window. Markets with large battery fleets saw calmer prices through the evening ramp than markets without.
  1. Reported peaks can hide the real number. In PJM, DR and curtailments masked underlying demand, so it's worth looking past the headline peak.
  1. Swings are the risk. The East's shift from below normal to 15-20 degrees above normal is where early, frequently updated forecasts pay off.

‍

Watch Amperon's 2026 Winter Weather Webinar to see what's in store as the Super El Niño continues!

‍

AI-driven Forecasting

Our advanced machine learning methodology delivers the accuracy you need to optimize operations and maximize profits.

  • 40K weather points from 4 vendors
  • 15-day short-term forecasts that update sub-hourly
  • Globally available
  • Leading UI/UX or API delivery
Book a demo

Want 3x more accurate forecasts? Let's talk.

Book a demo

Related articles

Left arrow icon for navigationRight arrow icon for navigation
Blog
September 29, 2026
Summer 2026 in Review: Record Heat, Record Power Demand
Open article
Blog
September 24, 2026
FTR Trading Strategies in a Changing Grid
Open article
Blog
September 17, 2026
Winter Storm Fern: A Case Study and Q&A with Amperon
Open article
Blog
September 18, 2026
Energy Demand Forecasting: A Beginner’s Guide
Open article
Blog
September 16, 2026
Why Your ETRM Is Only as Good as Its Forecast
Open article
Blog
September 24, 2026
Virtual Power Plants 101: How They Work and Why Forecasting Accuracy Matters
Open article
Blog
September 25, 2026
ERCOT 12CP: Why Texas is Moving from 4CP to Monthly Coincident Peaks
Open article
Blog
August 25, 2026
Frequency Regulation is Breaking Traditional Solar and Wind Forecasts
Open article
Blog
July 30, 2026
Amperon's 4CP Performance: June-July 2026
Open article
Blog
September 24, 2026
How Forecasting Helps C&I Operations Cut Energy Bills
Open article
Blog
August 4, 2026
Could Small Modular Reactors Close the Gap on AI’s Energy Demand?
Open article
Blog
September 2, 2026
7x Better than ERCOT: How Amperon Maintained Accuracy in Unusual Conditions
Open article
Blog
September 18, 2026
Data Center Energy Demand: The Top 5 Considerations for Power Traders
Open article
Blog
July 30, 2026
July 2026 Heat Event: How A Trader Could Have Made +$200 to $400/MWh
Open article
Blog
August 4, 2026
Amperon Integrates AI Weather Forecasting from ECMWF
Open article
Blog
July 24, 2026
Early July Heat Wave 2026: Forecast Models Signal Rising U.S. Power Demand
Open article
Blog
July 24, 2026
Transforming Seasonal Load Risk Planning for Utilities
Open article
Blog
July 23, 2026
Mexico's Grid Is Waking Up. Are Market Participants Ready?
Open article
Blog
July 23, 2026
The Top 3 European Grid Risks This Summer
Open article
Blog
July 23, 2026
The Top 3 US Grid Risks This Summer
Open article
Blog
July 24, 2026
Why Virginia Data Centers Matter to All of PJM
Open article
Blog
July 24, 2026
2026 US Summer Grid Preview
Open article
Blog
July 24, 2026
Two Perspectives on Net Load Forecasting
Open article
Blog
April 28, 2026
How Storms Compound Risk
Open article
Blog
July 23, 2026
The Art of Resource Adequacy
Open article
Blog
July 30, 2026
Can You Trade on a 3-Week Signal? Here's Proof.
Open article
Blog
July 23, 2026
DAME Brings New Costs to CAISO Market Participants on May 1
Open article
Blog
July 23, 2026
Why Data Centers are Moving Beyond Renewable Energy PPAs
Open article
Blog
July 23, 2026
When Batteries Break Your Forecast
Open article
Blog
March 26, 2026
The War in Iran and What It Means for Energy Forecasting
Open article
Blog
July 23, 2026
Ontario’s Market Renewal Program is a Major Success—Yet Volatility Remains
Open article
Blog
July 23, 2026
Seasonal Change Brings Forecasting Problems—Unless Your Model is Built for It
Open article
Blog
July 24, 2026
A Tale of Three Markets: The Winds of Change Blow Differently Across Europe
Open article
Blog
July 23, 2026
Quantifying Solar and Wind Uncertainty with Probabilistic Forecasting
Open article
Blog
July 23, 2026
The Future of Term Trading: Quantifying Tail Risk
Open article
Blog
July 23, 2026
Mitigating Curtailment Risk With Smarter Wind and Solar Forecasting
Open article
Blog
July 23, 2026
cnMAE: The Right Metric for Evaluating Solar & Wind Forecasts
Open article
Blog
July 23, 2026
How to Use Wind and Solar Forecasts: Net Load Forecasting and Day-Ahead Optimization
Open article
Blog
July 23, 2026
Uri vs. Fern: How ERCOT Learned to Bend Without Breaking
Open article
Blog
February 3, 2026
Before the Cold Hit: Early Demand Signals Behind January’s Arctic-Driven Power Price Surge
Open article
Blog
July 23, 2026
The Evolution of Energy Forecasting: From Deterministic to Probabilistic
Open article
Blog
August 12, 2026
Hedging Tail Risk: Term Traders Get a Powerful New Risk Management Tool
Open article
Blog
July 23, 2026
Sub-Hourly STF Improves Day-Ahead Positioning in the Era of Renewables
Open article
Blog
July 23, 2026
Behind PJM’s 800% Increase in Capacity Prices and Trump’s Emergency Auction Plan
Open article
Blog
July 23, 2026
Germany Proves Transmission is Just as Critical as Generation
Open article
Blog
July 23, 2026
How Amperon Won the Holidays
Open article
Blog
January 23, 2026
6 Grid Trends to Watch in 2026
Open article
Blog
August 17, 2026
Battery Energy Storage: ERCOT vs. CAISO
Open article
Blog
December 19, 2025
European Power Traders Finally Get One-Stop Forecasting
Open article
Blog
July 23, 2026
The Pacific Northwest Risks a 6 GW Shortfall This Winter
Open article
Blog
July 23, 2026
With Millions On the Line, Amperon Called Cold Snap 33 Days Out
Open article
Blog
July 23, 2026
Chilean Solar and Wind Asset Owners Face Hourly Reporting Under New Market Structure
Open article
Blog
July 23, 2026
Can PJM Keep Up with Exponential Load Growth?
Open article
Blog
August 12, 2026
US Winter Weather Outlook 2025–2026: Mild on Paper, Volatile in Practice
Open article
Blog
July 23, 2026
Ontario’s Day-Ahead Market is a Renewables Profitability Test
Open article
Blog
August 17, 2026
US Solar and Wind Curtailment Is Exploding
Open article
Blog
July 23, 2026
Navigating the RTC+B Paradigm Shift
Open article
Case study banner reading “Nailing MISO’s Fall 2025 Coincident Peak” with a computer displaying grid demand forecasts
Blog
July 23, 2026
Nailing MISO's Fall 2025 Coincident Peak: A Week-Ahead Perfect Call
Open article
Amperon MTF model visualization displaying market trends and forecasts
Blog
July 23, 2026
Unlocking Intelligent Term Trading and Seasonal Planning  
Open article
Blog post header with palm tree in hurricane winds asking Why Has This Hurricane Season Been So Quiet with Amperon branding
Blog
December 5, 2025
Why Has This Hurricane Season Been So Quiet?
Open article
Table showing parallel flow congestion scenarios across different energy markets including ISO/RTO, WEIM, WEIS, Markets+, and EDAM with scheduled delivery systems and mitigation strategies
Blog
July 23, 2026
CAISO Breaks the Transmission Hedge
Open article
Amperon blog post graphic asking High ERCOT Demand, Low Wind, and No Price Spike? with load forecast chart for August 18, 2025
Blog
August 12, 2026
High ERCOT Demand, Low Wind, and No Price Spike?
Open article
ISONE May hourly average load comparison chart showing data from 2023, 2024, and 2025 with peak loads around 13,534 MW at HE17-18
Blog
July 23, 2026
Electrification and BTM Solar: Reshaping Demand in ISO New England
Open article
Line graph showing MISO Net Load from 2022-2025 comparing hourly load patterns ranging from 50,000 to 90,000 MW across 24-hour period
Blog
August 10, 2026
The Rise of the Duck Curve in ERCOT: A Shift in Net Demand Peak and the Future of Solar Power Integration
Open article
Amperon market analysis titled Where's the Chaos? ERCOT's Surprisingly Quiet Summer with curved line graph showing peak demand trends from 2022-2025
Blog
December 5, 2025
Where’s the Chaos? ERCOT’s Surprisingly Quiet Summer
Open article
Amperon forecasted load versus prediction time by weather vendor chart for PJM on June 24, 2025, showing settled demand at 158.2 GW with multiple vendor forecasts (ENS_1, NBM, DTN, AG2)

Blog
July 23, 2026
PJM Breaks 10-Year Peak Load Record — and Amperon Saw It Coming 7 Days Out
Open article
Blog
July 23, 2026
PJM Forecast: June 23–25 Heat Wave May Shatter Summer Expectations
Open article
Blog
July 23, 2026
ISONE’s First Heat Spike of Summer- and Amperon Nailed It
Open article
Amperon whitepaper cover titled Cost of Uncertainty: The Challenges and Value of Accurate Price Forecasting with download button, dated March 2025
Blog
July 23, 2026
Why Wholesale Electricity Prices are ESPECIALLY Volatile in Texas
Open article
Blog
July 23, 2026
Powering Profitable Growth for Retail Electricity Providers: Turn Load Forecasting into Your Competitive Edge
Open article
Blog
August 17, 2026
What Is 4CP? ERCOT's Coincident Peak Program Explained
Open article
Amperon promotional banner announcing sub-hourly grid forecasts for European TSOs now available, featuring transmission tower with geometric orange and blue design elements
Blog
August 12, 2026
Europe’s Shift to 15-Minute Power Markets: How Amperon Helps You Prepare for Market Evolution
Open article
Amperon blog post graphic titled "The Shape Shift: How Texas Net Demand Transitions from Shoulder to Summer" with wind turbine image
Blog
July 23, 2026
The Shape Shift: How Texas Net Demand Transitions from Shoulder to Summer
Open article
Amperon presentation slide titled "ERCOT's Evolving Price Dynamics 2021-2024 Analysis" with sunset transmission tower image
Blog
July 30, 2026
ERCOT’s Evolving Price Dynamics [2021-2024 Analysis]
Open article
A promotional image announcing the introduction of real-time grid price forecasts now live in ERCOT, featuring Amperon branding
Blog
July 23, 2026
Amperon Expands Forecasting Capabilities with Real-Time Price Predictions in ERCOT
Open article
Blog
July 23, 2026
MISO’s VOLL Change Could Reshape Scarcity Pricing and Reliability Signals
Open article
Blog
July 23, 2026
Why Behind-the-meter Solar Complicates Spring Forecasting
Open article
Comparison table showing solar and wind forecasting capabilities across Machine Learning, Physics-based, and Amperon (ML+PB) approaches for partial asset metadata, soiling, equipment degradation, biased weather, and curtailment
Blog
August 17, 2026
How to Forecast Energy Generation for Wind or Solar Assets
Open article
Day-ahead grid MAPE summary table for 2024 showing 12-month average comparison of ISO MAPE, Amperon MAPE past models, current models, and improvement percentages across multiple ISOs (AESO, CAISO, ERCOT, ISONE, MISO, NYISO, PJM, SERC, SPP, CH, DK, ES, IE)
Blog
July 23, 2026
Always Innovating: Amperon’s New Techniques to Improve Energy Forecasting
Open article
Amperon recap slide for April 7 titled "Why prices in ERCOT soared to $4000 per MW" with pastoral field landscape at golden hour
Blog
July 23, 2026
High Net Demand and Outages Caused Recent Price Spike in ERCOT
Open article
Amperon ebook promotional banner "Price Forecasting: Cost of Uncertainty - The Challenges and Value of Accurate Price Forecasting" with free ebook download button on gradient blue-green background
Blog
July 23, 2026
Are ERCOT’s morning ramp DA prices really higher than summer?
Open article
Infographic titled "Types of Data Relevant to Both Solar and Wind Assets" showing three categories: Nameplate Capacity, Location of Asset, and Historic Curtailment with wind turbines and solar panels imagery
Blog
July 23, 2026
Inside our Data: Intro to Renewable Asset Data
Open article
Amperon promotional slide "Adapting to OMIE's 15-Minute Transition: How Granular Forecasts Can Help You Stay Ahead" with laptop showing asset-level solar sub-hourly forecast for January 12, 2025
Blog
July 23, 2026
Adapting to OMIE’s (Portugal and Spain) 15-Minute Transition: How Granular Forecasts Can Help You Stay Ahead
Open article
Blog
December 11, 2025
What the beginning of daylight savings time means for peak pricing
Open article
Amperon presentation slide "How the Grid Changed in 2024" with aerial view of large-scale solar farm installation in agricultural setting at sunset
Blog
July 23, 2026
How the Grid Changed in 2024
Open article
Amperon recap slide for February 14-20 titled "Another cold week on the grid, another good week for Amperon's demand forecasts" with wind turbines in snowy landscape
Blog
July 23, 2026
Another cold week on the grid, another good week for Amperon’s demand forecasts
Open article
Blog
December 11, 2025
The Future of Western Power Markets: Why Implementing a Day-Ahead Market Matters
Open article
Blog
July 23, 2026
Harnessing the power of sub-hourly and hourly forecasts for wind assets
Open article
Blog
July 23, 2026
Forecasting for the Super Bowl: How much does the big game really affect demand?
Open article
Amperon promotional banner stating "33% more accurate in MISO" with blue gradient background and solar panels with wind turbines imagery
Blog
July 23, 2026
Best Demand and Net Demand Forecasting Calls to End 2024
Open article
Amperon slide featuring Punxsutawney Phil prediction reference titled "What Punxsutawney Phil's prediction for 6 more weeks of winter really means for the grid" with snowy groundhog image
Blog
July 23, 2026
What Punxsutawney Phil’s prediction for 6 more weeks of winter really means for the grid
Open article
Blog promotional graphic on navy background titled "New Blog: Why a hybrid regression/ML approach outperforms in energy forecasting" with layered visualization showing Linear Regression, Boosted Trees, and Additional secondary models
Blog
July 23, 2026
Why a hybrid regression/ML approach outperforms in energy forecasting
Open article
Blog
July 23, 2026
Europe 2024 Best Amperon Forecasting Calls and Trends to Watch
Open article
Title slide reading "Part 1: Inside Our Data: The Importance of Granular Weather Data" by Lily Bowdler from Amperon
Blog
July 23, 2026
Inside our Data: The Importance of Granular Weather Data
Open article
Bar chart showing 2025 Highest ISO Demand Levels So Far across four ISOs: ERCOT (68.9 GW), PJM (126.8 GW), MISO (97.9 GW), and SPP (43.1 GW)
Blog
July 23, 2026
Déjà vu? With one cold snap down, will we have a repeat of last MLK weekend?
Open article
Blog promotional slide "The first winter cold snap is here, but will it break records?" with laptop displaying PJM weather data showing 5-year, 10-year, and 30-year normals for various cities
Blog
July 23, 2026
First winter cold snap is here, but will it break records?
Open article
Blog
July 23, 2026
Looking Back (and Ahead): A Year-end Q&A with Amperon CEO Sean Kelly
Open article
Line graph comparing Ireland Wind Generation forecasts for August 20-26, showing Actual Wind, Amperon Day Ahead Wind Forecast, and EirGrid Day Ahead Wind Forecast (duplicate of image 43)
Blog
July 23, 2026
How strong winds in Ireland left power market stakeholders exposed
Open article
Line graph of CAISO demand for Indigenous Peoples Day 2024 (October 11-14), showing Duck Curve pattern and comparing Amperon Day Ahead, ISO Day Ahead, and Actuals
Blog
July 23, 2026
Forecasting for the holidays: How holidays affect demand patterns
Open article
Blog
June 3, 2025
When tech buys nuclear, who wins?
Open article