

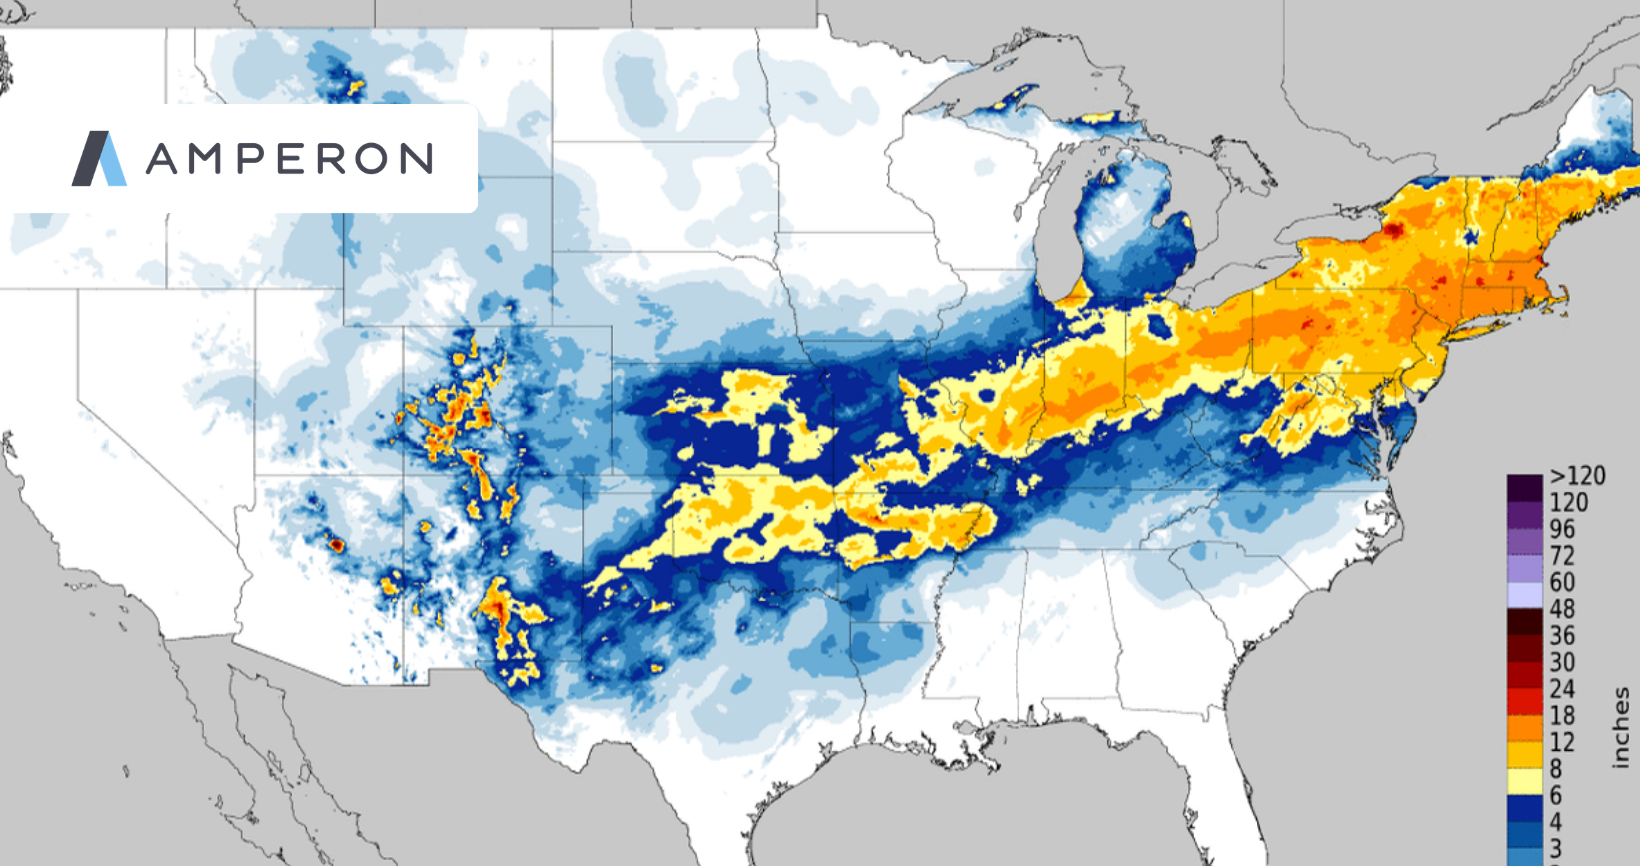
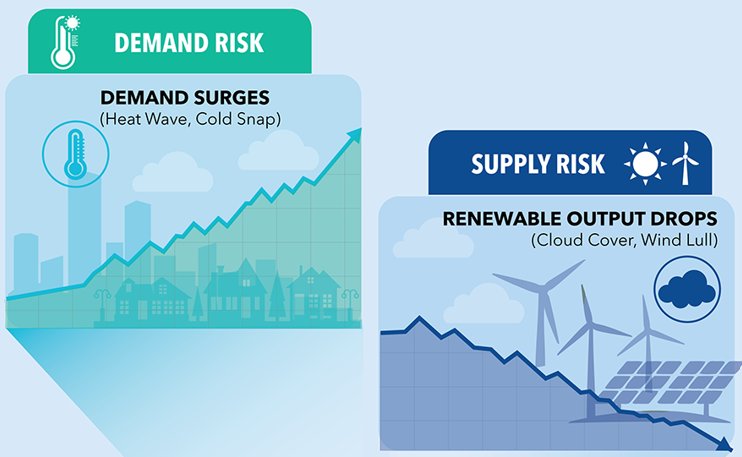
Extreme events don’t introduce new risks, but they do cause existing correlated risks to stack up. Rising demand compresses margins just as solar and wind output change suddenly, fuel delivery becomes constrained, and thermal plants face elevated outage risk.
In fact, extreme weather can test assumptions about supply as much as demand. Particularly in grids with high renewable energy penetration, solar and wind forecasts can anchor a new strategy for maintaining resource adequacy—but they require a new way of thinking about net load or residual demand.
Load Risk Management is an Impossible Job
Load risk managers have to plan for worst-case scenarios every day. Of course, most days, all that planning appears unnecessary, except when it’s not. The trick is to understand when to kick stress testing into high gear to account for the likely possibility of multiple overlapping failures, not just isolated risks.
Thermal outages, fuel constraints, and transmission limitations are difficult to influence in the short term, especially in the throes of extreme weather. What utilities can influence is 1) recognizing when their system is potentially at risk well before it happens, and 2) evaluating how likely those risks are in order to inform trading strategies, stress testing, and contingency planning.
The trick is to understand when to kick stress testing into high gear to account for the likely possibility of multiple overlapping failures.
The Art of Resource Adequacy During Extreme Events
There is an art to maintaining grid reliability when demand rises and renewable output falls. The key is to stay grounded in a source of truth and amid ever-changing conditions. This helps prevent multiple compounding uncertainties from spiraling out of control, which can cause planners and operators to either overreact—or worse, to miss the signal through the noise.
Specifically, probabilistic solar and wind asset forecasting can be a valuable addition to net load forecasting. Rather than offering a single expected outcome, probabilistic forecasts describe a range of plausible scenarios. They make downside renewable generation risk explicit, allowing planners to see how often—and how severely—assets could underperform during periods of system stress.
The art lies in weighing both net load forecasting and probabilistic renewable asset forecasting to triangulate real-world risk for a given portfolio and get a handle on compounding uncertainty.
The art lies in weighing both net load forecasting and probabilistic renewable asset forecasting to triangulate real-world risk.
The Difference Between Renewable Asset Forecasting and Net Load Forecasting
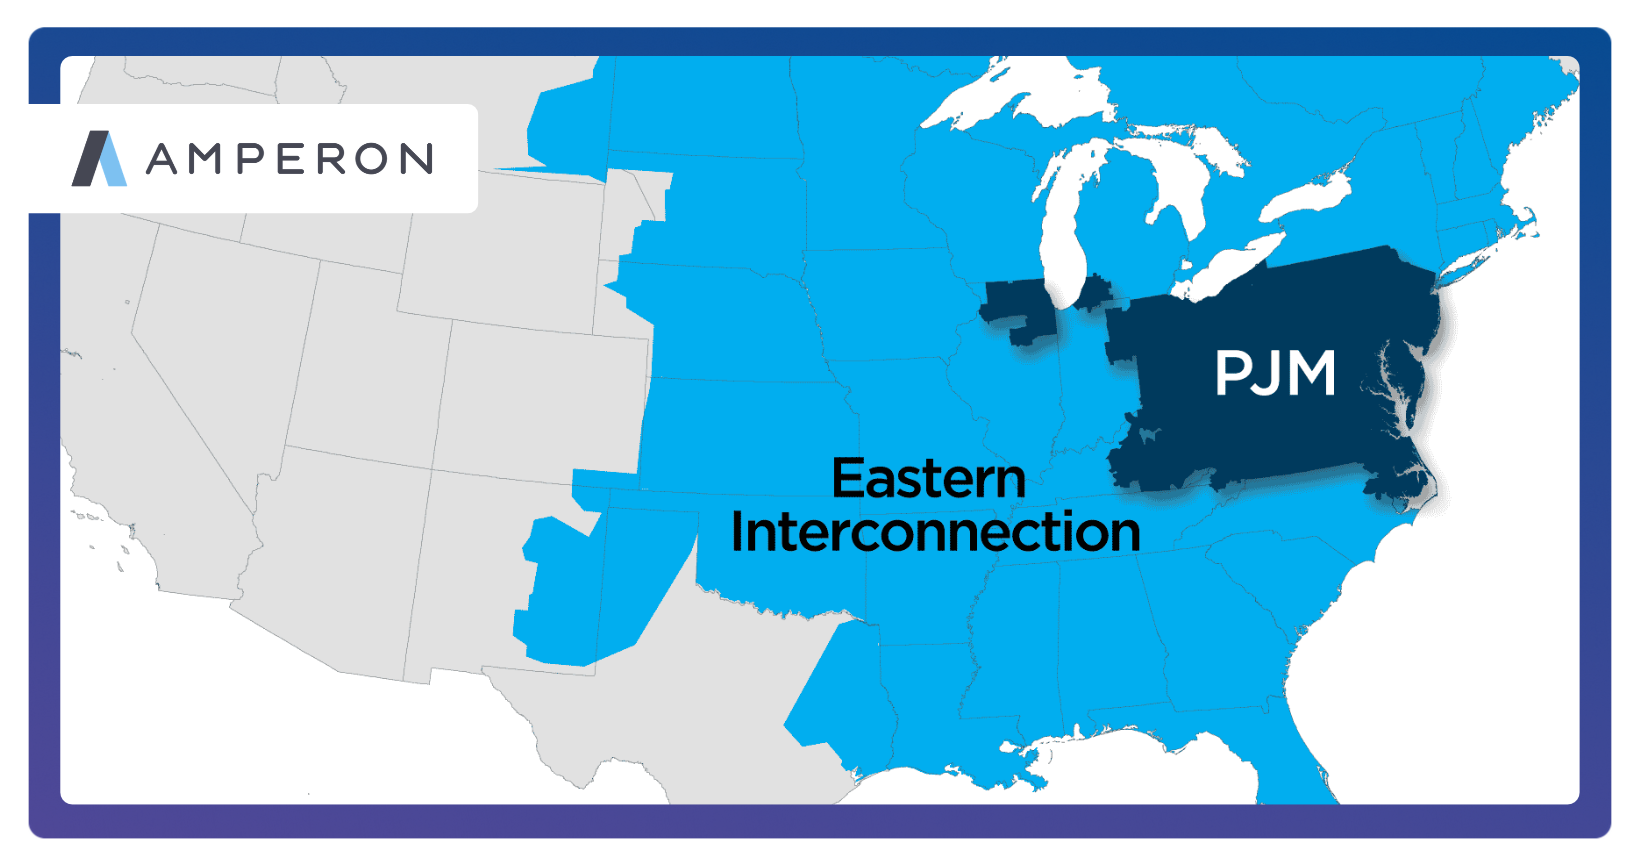
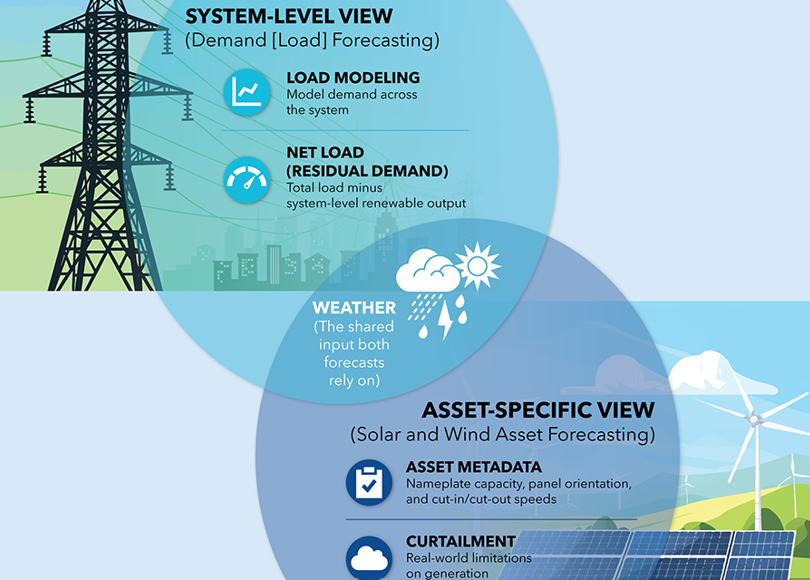
Net load forecasts are essential, but they are built to describe the system as a whole. They reflect demand minus renewable output, in aggregate, and are optimized for ISO‑level balancing rather than utility‑specific risk.
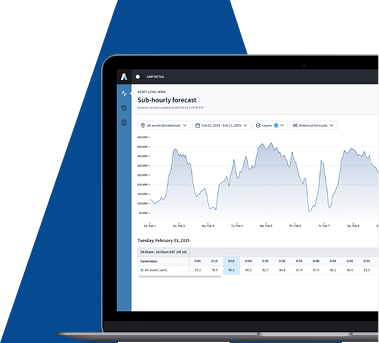
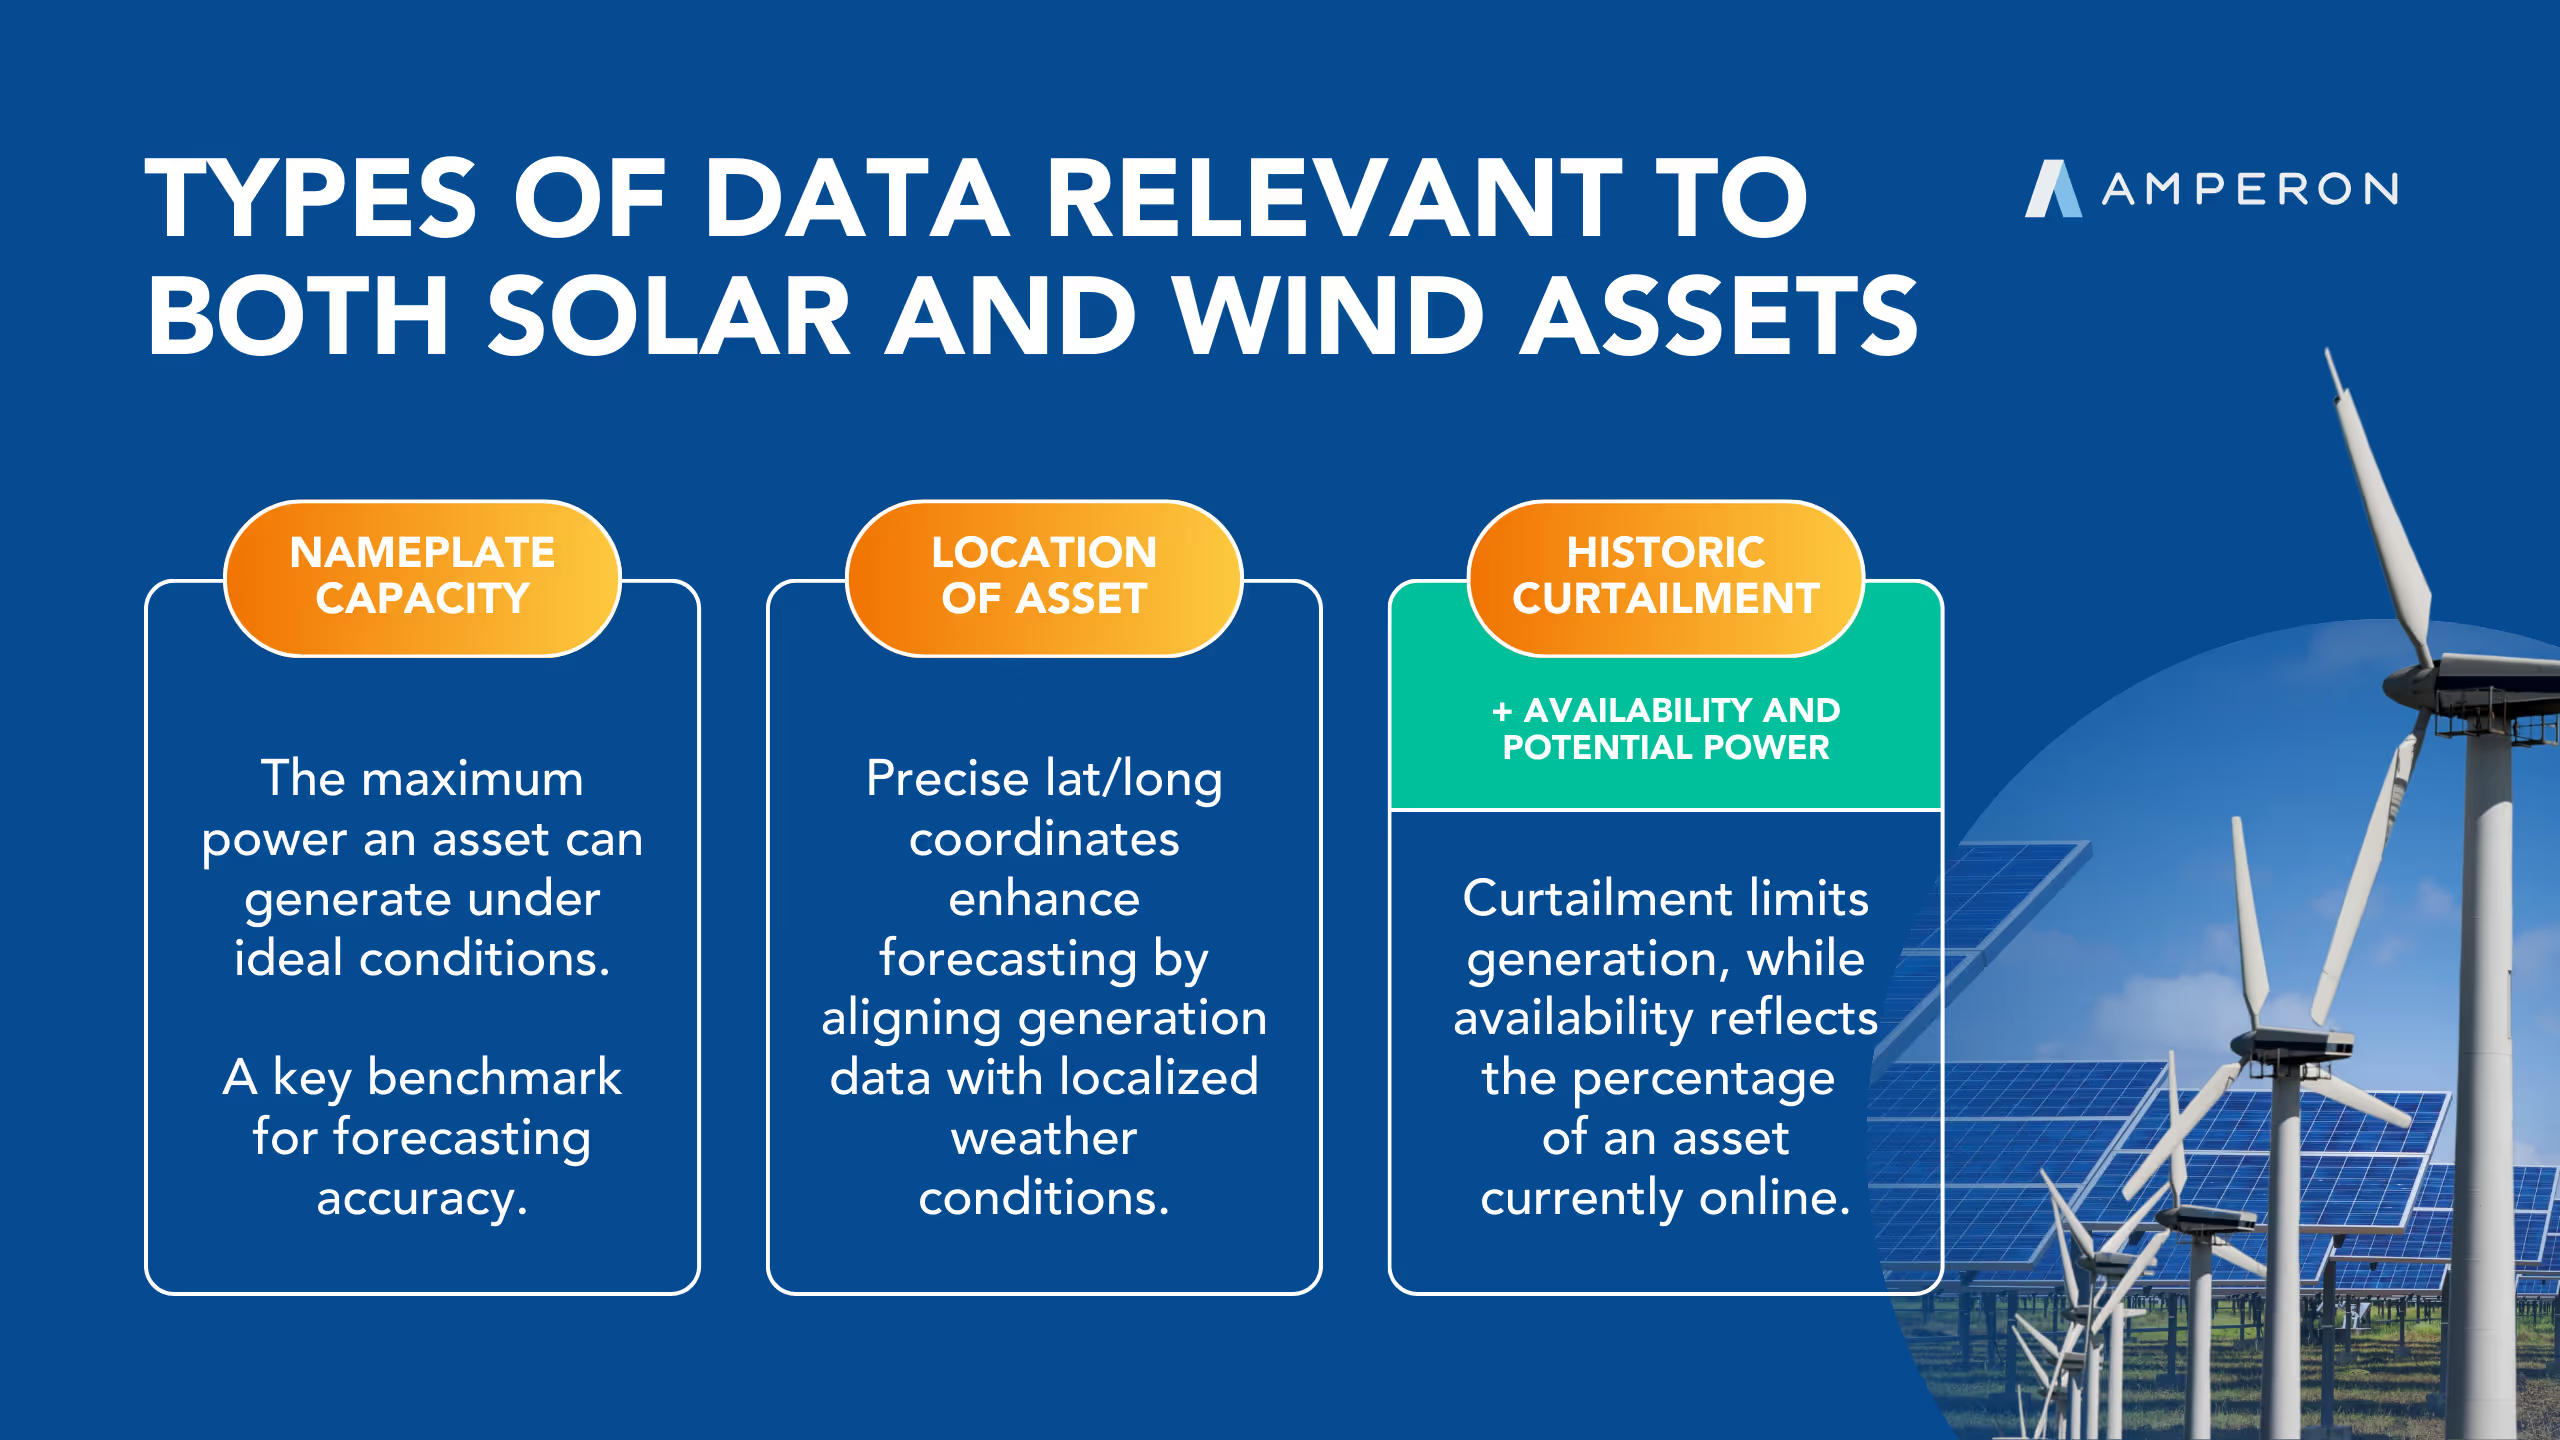
Renewable asset forecasting serves a different purpose. It focuses on a specific utility’s renewable generation resources, incorporating crucial asset metadata such as solar orientation, wind turbine cut‑in and cut‑out thresholds, terrain effects, shading, and known performance constraints. This level of detail reveals how specific assets are likely to respond to specific weather conditions.
The distinction is not simply disaggregation. Asset‑level forecasts fundamentally change how planners interpret uncertainty. They explain not just how much renewable output may vary, but where, when, and why it may fall short. In particular, probabilistic forecasting helps load risk managers know when conditions justify an emergency posture. And the earlier they can see those conditions coming, the more chance they have of locking in hedges, securing imports, or making operational changes that reduce risk.
For load risk managers, this shift is crucial. Probabilistic forecasts make risk explicit, supporting better supply stack decisions to maintain resource adequacy intelligently, without assuming that every forecast miss will become a crisis.
Probabilistic forecasting helps load risk managers know when conditions justify an emergency posture.
Explore Load Risk Management Solutions.

.svg)











































%20(3).png)
%20(2).png)
%20(1).png)






.png)


.avif)



.avif)
.avif)

.avif)

.avif)
%20(15).avif)
.avif)


.avif)

.avif)



