

Executive Summary
Renewable asset owners face growing financial risks posed by the world's increasingly complicated grids. To manage these risks, solar and wind operators rely on forecasts to inform their power purchase agreements and power market bidding. This paper evaluates the pros and cons of both physics-based (PB) and machine learning (ML) forecasting models. It then outlines a hybrid approach that can combine the best of both types. This hybrid approach helps protect revenue by improving forecast accuracy, mitigating threats like congestion, curtailment, and negative pricing. For the growing number of battery-tied installations, the hybrid forecasting approach also helps inform optimal battery charging and dispatch.
Congestion, Curtailment, and Negative Pricing: The Triple Threat to Renewable Asset Owners
Solar and wind operators worldwide face growing financial risks from congestion, curtailments or forced exports, and negative pricing. Grid operators can trigger these effects at any time to maintain grid reliability and keep transmission lines operating effectively. This not only costs asset owners money, but also makes it difficult to predict revenue timing.
Congestion is not just a bottleneck; it’s a revenue risk
When too much generation occurs in a localized area without sufficient local demand, transmission lines become congested. Congestion is a measure of the constraint on transmission when transporting electricity from one region to another.
In de-regulated markets, this has two key consequences:
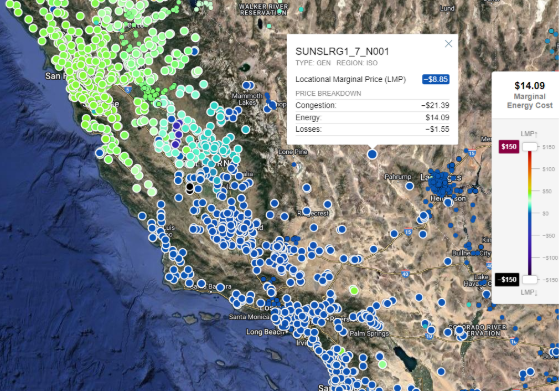
- Price volatility: Congestion heavily influences Locational Marginal Prices (LMPs), creating sharp spikes or collapses depending on where the constraint occurs.
- Settlement risk: In some cases, congestion can also trigger separate settlement charges, adding another layer of cost exposure.
For load-serving entities, congestion can mean unexpected costs and complex hedging techniques. Modeling these risks requires power flow modeling—a notoriously difficult task that goes far beyond demand forecasting. Factors like weather-driven transmission disruptions, planned outages, parallel flows, and real-time generation availability all make accurate modeling challenging.
For generators, congestion risk cuts even deeper. When constraints arise near a generator’s node, grid operators may assign negative LMPs—meaning the generator must pay to inject power into the system. At that point, owners are forced to curtail, losing revenue opportunities. These swings can occur as quickly as every 5 minutes in real-time markets, making short-term visibility critical for decision-making.
Curtailments increasingly shut down renewables
To maintain reliability in the face of congestion, grid operators can—and often do—order curtailments and forced exports. This is increasingly common in high-renewable grids. In California, for example, CAISO curtailed 3.4 million MWh in 2024, primarily solari—accounting for nearly 7% of the state’s solar generation.ii
Curtailments inevitably mean lost revenue. A June 2025 study on Spain found that just 2.5% curtailed energy reduced net present value for affected PV asset owners by nearly 8% and increased levelized cost of electricity for those projects by over 2%.iii Forced exports can also depress revenues if the exported power clears at lower prices than it would in its home market.
Curtailments introduce additional challenges beyond lost revenue. They can skew forecasting models if unindicative events are treated as actual asset performance. Because curtailments reflect system constraints rather than generation capability, machine learning models that don’t account for this distinction risk compromising accuracy.
It’s worth noting that while the continued expansion of renewables threatens to accelerate curtailments, the rise of battery energy storage in many markets is likely to mitigate this effect.
SPOTLIGHT: CALIFORNIA
In California, abundant mid-day solar generation leads to congestion and curtailment
California has seen steady growth in solar capacity in recent decades thanks to the state’s abundant sun and supportive policies. Mid-day solar generation often exceeds local demand, especially in Southern California’s main hub known as SP15.
Excess supply leads to major congestion costs, curtailments, and exports to prevent grid overloading. Curtailments alone can reach thousands of hours a year, causing significant financial losses for many asset owners. While some assets are able to operate profitably at negative prices thanks to RECs, PPAs, or other contracts, not all assets have this protection.
The Northern California hub NP15 often sees real-time price spikes tied to imports from SP15. These spikes are driven by congestion costs as power flows north. They are especially common during solar-peaking hours, when SP15 has a significant oversupply of generation and therefore negative prices in the South.
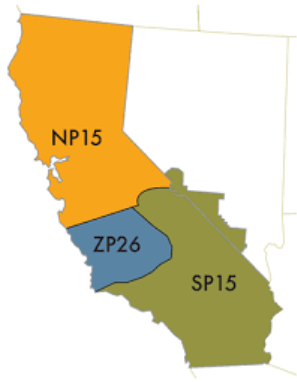
Sources: CAISOiv, WesternPowerGrid.comv
Negative pricing can force operators to pay to dispatch power
When congestion charges or line losses are sufficiently high, energy prices can go negative. For exposed asset owners without contractual protection, this means they must pay to dispatch power onto the grid. This is a worst-case scenario for many operators, yet it is not uncommon.
Many asset owners are forced to continue operating at negative prices due to contractual obligations or other factors. While some assets are able to operate profitably at negative prices thanks to RECs, PPAs, or other contracts, not all assets have this protection.
These risks are especially acute in markets with a high penetration of renewables. California, for example, frequently sees negative Locational Marginal Prices (LMPs) during the mid-day hours. In 2024, Southern California alone saw 1,180 hours of negative pricing.vi That’s an average of over 3 hours a day year-round, and much of this is concentrated in the shoulder seasons.
In addition, the median negative price in 2024 was roughly -$17 compared with roughly -$10 in 2023, indicating that both the frequency and magnitude of negative prices have increased.vii
As the energy landscape evolves, so too must our forecasting methodologies. As the risks of congestion, curtailment, and negative pricing grow and compound, accurate forecasting is becoming more critical every day. Yet, forecasting models often fail to reflect real-world asset behavior or local grid conditions.
SPOTLIGHT: GERMANY
In Germany, wind energy congestion causes fossil plants to come online
Germany’s grid struggles with bottlenecks, especially on north–south transmission corridors, as abundant northern wind generation must be transported to load centers further south. As in California, this can lead to negative pricing, curtailments, and exports to prevent strain on the grid.viii Germany’s DE_LU hub recorded 457 hours of negative electricity pricing in 2024, up from 301 hours in 2023.ix, x
Even with these disincentives in place, Germany’s Transmission System Operators (TSOs) must spend billions of Euros a year on grid stability. Wind power is generally less predictable than solar power on all time scales. Unlike solar, which follows a relatively consistent diurnal pattern, wind can fluctuate unexpectedly, leading to overall increased market risk which could include increased costs, curtailment risks, and reduced market revenues if forecasts are inaccurate.
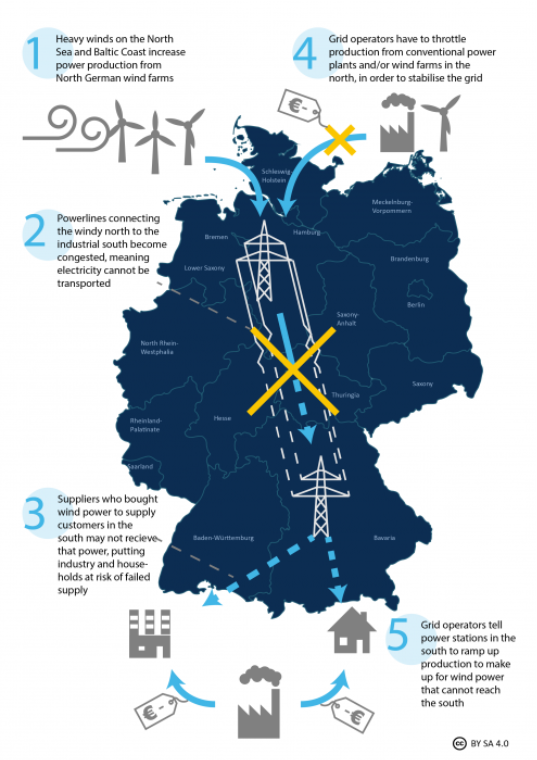
Source: EnergyTransition.orgxi
To alleviate these constraints, TSOs issue redispatch orders—reducing output in the North and increasing generation in the South, often from fossil plants. While this helps ensure reliability, it imposes operational uncertainty on renewable asset owners while also failing to reduce carbon emissions as promised. Unlike CAISO, where battery storage is increasingly mitigating curtailments, the nature and geography of German grid constraints make forecasting and redispatch particularly complex, requiring models that incorporate local congestion patterns and cross-border flows.
SPOTLIGHT: BRAZIL
In Brazil, curtailment is putting the energy sector on the brink
Curtailment has reached extreme levels in Brazil, driving a fervorous discussion about grid reform. Wind and solar curtailments grew 230% year over year from January to August 2025, reaching nearly 20 TWh just two-thirds the way through 2025—double the figure from the full year prior. Most curtailments, including all those for “energy” or “reliability” reasons, are not currently eligible for compensation under agency rules, shifting significant cost risk to generators.xii

Source: Rystad Energyxiii
The economic impacts are massive. The National Interconnected System (SIN)’s average curtailment is over 3,000 MW, causing losses of R$3.2 billion (~US$600 million) to the local energy sector.xiv One research group estimates that curtailment risk is adding R$40/MW (~US$7/MW) to the cost of new renewable PPAs in Brazil.xv
All this has led to urgent calls for both short-term measures to protect the interests of generators as well as long-term measures to modernize the transmission system, reform regulatory markets, and more. If implemented well, these reforms could significantly reduce curtailment risk and improve investment confidence. In the meantime, asset owners must develop new processes to forecast and mitigate curtailment impacts.
Wind and Solar Forecasting Methodologies: The Pros and Cons of Physics-Based and Machine Learning Models
Accurate renewable generation forecasting allows asset owners to bid optimal capacity and energy into power markets. Forecasting is not new, but the methods used are rapidly evolving. Traditional physics-based models simulate the real world based on theoretical data. Machine learning-based forecasting makes inferences informed by real-world data. Each methodology has distinct benefits and limitations.
Physics-Based Wind and Solar Forecasting Provides Situational Context
Traditional forecasting informs decision making grounded in the physical boundaries and operating constraints of a system—factors that historical data alone can only approximate. All physics-based models include variables like location and nameplate capacity. Additional wind asset variables include power curves, cut-in and cut-out speeds, etc., while common solar asset variables include panel tilt (slope) and azimuth (degrees from true north). These static variables are then combined with weather data to predict actual output.
Advantages of Physics-Based Energy Forecasting Models
Physics-based (PB) models provide situational context that grounds decisions in reality. The laws of physics dictate certain parameters like the relationship between wind speed and friction or a solar panel’s maximum efficiency. No prediction should ever stray from these principles. This keeps traditional forecasting methods relevant today and into the future.
Limitations of Physics-Based Energy Forecasting Models
Physics-based models assume ideal conditions. They try to simulate a hypothetical world, but it’s nearly impossible to predict real-world performance without incorporating historical behavior. If a site is experiencing equipment degradation, panel soiling, or obstruction, for example, asset metadata will be unable to capture the full picture.
Additionally, because weather is their only ongoing input, PB models are extremely reliant on accurate weather data and weather model parameters. When models depend on interpolated or gridded weather data, such as from an ISD station, their relevance to actual site conditions can be limited. Moreover, the choice of weather variables matters. Temperature, for instance, may actually be less predictive of wind output than it is of energy demand.
Machine Learning-Based Wind and Solar Forecasting Captures Historical Context
Machine learning (ML) models use a type of Artificial Intelligence (AI) to make inferences based on real-world data rather than hard-coded rules. It trains a model based on historical data, then it applies this model to new data. New data can also be fed back into model training, allowing ML models to adapt to evolving situations and continuously improve.
Advantages of Machine Learning Energy Forecasting Models
ML models tend to outperform physics-based models in detecting site-specific patterns. They can learn from the real-world impact of factors that physics models often miss, such as equipment degradation or malfunction. Not only can they incorporate historical patterns, but they can continue to learn from new events. This makes ML forecasting extremely popular today.
Limitations of Machine Learning Energy Forecasting Models
For proper ML model training, clean and well-groomed data is essential. Many renewable assets experience curtailments or outages, which introduces additional complexity—especially when asset owners aim to forecast full, un-curtailed production rather than actual delivered energy. In these cases, it’s critical that curtailment periods and outages are excluded from model training to avoid skewed results.
Unfortunately, many asset owners don’t store this data reliably in their data lakes due to SCADA limitations, compromising the accuracy of the training process. Variables like max power (also known as setpoint or curtailment), potential power (often referred to as High Sustainable Limit or HSL), and availability (representing outages) are key to understanding these anomalous events, yet they are not always readily available.
Summary of Renewable Energy Forecasting Methodologies
Traditional and AI-powered forecasting both have strenghts and limitations. Physics models provide some grounding in absolute truths, while machine learning models can capture real-world data and adapt to changing circumstances. Physics models rely on idealized assumptions and weather inputs, while ML models can be distorted by curtailments and outages.
The Best of Both: A Hybrid Approach to Wind and Solar Forecasting
To mitigate risk, operators can use a hybrid forecasting approach that combines the best of both machine learning and physics-based models. A hybrid model can capture the strengths of both methodologies while helping overcome the limitations inherent in each.
Amperon addresses real-world issues like equipment degradation, inverter malfunctions, panel soiling, and obstructions by incorporating historical trends and continuously updated data, as well as by placing more weight on recent performance to reflect current asset behavior.
We also ingest key metavariables like azimuth and tracking (for solar) and cut-in/cut-out speeds (for wind), providing essential physical context that purely ML-based models may overlook.
To ensure weather inputs are as relevant as possible, we generate localized forecast points based on each asset’s exact latitude and longitude, capturing hyper-local fluctuations that can significantly affect generation.
For curtailment and outage handling, asset owners have the option to provide data like max power, potential power, and availability, which allows us to exclude non-representative periods from model training. For cases where such data is not available, we’ve also built a curtailment detection system that identifies significant underperformance and automatically excludes those periods from the training dataset.
Forecasting Is Even More Important for Batteries and Hybrid Installations
The rise of battery energy storage systems, especially those paired with renewable generation, is directly correlated with the rise in congestion, negative pricing, and curtailments. While it would be easy to think energy storage would make accurate renewable energy forecasting less important, the opposite is true.
For battery operators, knowing when to charge and when to dispatch is extremely important for energy arbitrage. Whether for energy storage systems alone or for hybrid renewable-plus-storage installations, maximizing revenue requires not only accurate grid-level forecasts of demand and prices, but also highly granular wind and solar forecasts.
These detailed predictions allow owners to anticipate renewable energy available for storage in advance of peak net load periods. This helps minimize charging costs while also making maximal power available during opportune times, increasing revenue for battery operators while simultaneously improving grid reliability, efficiency, and emissions.
A Note on Evaluating Renewable Energy Forecasting Error
For renewable asset owners, evaluating forecast accuracy is more complex than it is for traditional load forecasting. Common metrics like Mean Absolute Percentage Error (MAPE) break down when actual generation values approach zero—a frequent occurrence for solar and wind assets—resulting in misleading or infinite error values. Alternatives like normalized MAE (nMAE) and RMSE address some of these issues but introduce others: nMAE fails to account for seasonal variation, while RMSE is sensitive to asset scale and doesn’t reflect the relative impact of errors across different capacities.
A more effective metric for asset-level forecasting is capacity-normalized MAE (cnMAE), which adjusts for both seasonal variability and asset size. This allows asset owners to compare performance across diverse assets and time periods with greater confidence. By using cnMAE, operators gain a clearer picture of how well forecasts align with actual generation potential—critical for optimizing dispatch decisions, managing risk, and improving revenue outcomes. See Amperon’s cnMAE white paper for further details.
Conclusion
In an era of increasing renewable generation and grid volatility, reliable asset-level forecasting is more critical than ever. Advances in wind and solar generation forecasting help asset owners protect revenue against threats like congestion, curtailment, and negative pricing.
Both physics-based and machine learning forecasting methodologies have unique strengths and weaknesses. By addressing the gaps in each, hybrid forecasting sets a new standard for forecast reliability.
By integrating asset-specific metadata, localized weather inputs, and machine learning trained on clean historical data, Amperon helps operators anticipate grid constraints, optimize battery dispatch, and reduce exposure to market volatility.
Learn more about Amperon’s short-term wind and solar forecasting methodologies here.
Contact Amperon to discuss your renewable asset optimization and risk mitigation strategies.
References:
iii https://iris.uniroma1.it/retrieve/7cdc9f28-612e-41d1-bec2-75b6a976af61/Micheli_Energy
iv https://oasis.caiso.com/mrioasis/logon.do
v http://www.westernpowergrid.com/2023/10/15/electricity-markets-isos-and-locational-marginal-pricing/
viii https://www.sciencedirect.com/science/article/pii/S0306261923017154
x https://www.sciencedirect.com/science/article/pii/S0306261923017154#dfig1
xi https://www.cleanenergywire.org/factsheets/re-dispatch-costs-german-power-grid


.svg)


%20(3).png)
%20(2).png)
%20(1).png)


.png)


.avif)


.avif)

.avif)


.avif)


.avif)
%20(15).avif)

.avif)
%20(10).avif)

.avif)


.avif)

.avif)


.avif)


