

When PJM published its 2021 Long-Term Load Forecast, it projected net energy growth of just 0.3% per year across its footprint over the following decade, with individual zone growth rates ranging from -0.7% to 0.9%. At the time, those numbers made sense. Demand was stable, forecasts were modest, and there was little reason to expect otherwise.
What followed over the next five years told a very different story, and the data points squarely to one load zone above all others: DOM, the Dominion zone covering most of Virginia and a slice of North Carolina.
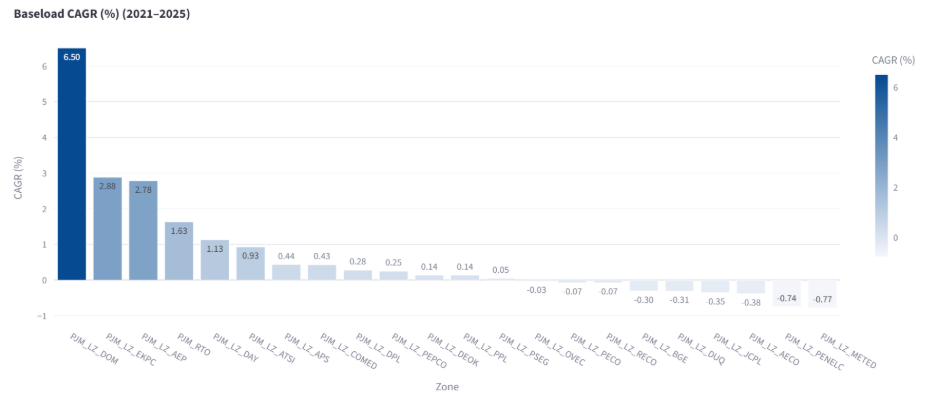
Between 2021 and 2025, DOM's weather-normalized load grew 6.50% per year. Nothing else in PJM comes close. EKPC came in second at 2.88%, AEP at 2.75%, and the RTO as a whole averaged just 1.63%.
Below that, most load zones sat at roughly 1% growth or less, and some saw negative growth over the period. In other words, Dominion’s growth skewed the entire grid’s numbers. And even within the DOM region, load growth is concentrated in a specific geography.
Why Data Center Alley Weighs So Heavily on PJM
Data centers are spread across Virginia, but 80% of the state's data center industry is concentrated in just three Northern Virginia localities—Loudoun, Prince William, and Fairfax—with Loudoun County alone accounting for approximately half of the state's data center industry in terms of number of sites, building square footage, and estimated energy usage.
That stretch of Loudoun County is what the industry calls "Data Center Alley," and according to the Virginia Economic Development Partnership, Virginia hosts the largest data center market in the world and is home to more than 35%—approximately 150—of all known hyperscale data centers globally.
As JLARC documented in its December 2024 study, roughly 70% of global internet traffic flows through Northern Virginia, with the vast majority of those facilities served by Dominion Energy. That is not a regional story. That is a global infrastructure story playing out on one grid, in one load zone.
Roughly 70% of global internet traffic flows through Northern Virginia.
Load Growth Beyond Virginia
The RTO number reflects the full distribution, but it does not tell you where growth is happening; the zone-level data does. DOM's growth story is the most dramatic, but it is not the only one worth noting. The RTO’s overall growth rate of 1.63% is an average across all load zones, and as the data shows, several zones saw flat or negative growth over the 2021–2025 period, pulling the overall average down. DOM's 6.50% pulls it up, boosted by EKPC and AEP.
AEP, covering Ohio, West Virginia, and parts of surrounding states, reflected a weather-normalized baseload CAGR of 2.78% over the same period, and its drivers share clear parallels with what is happening in Virginia, if on a smaller scale. AEP Ohio has contracts with several hyperscale data center customers, alongside over 300 MW of industrial additions. Within Appalachian Power, growth is driven entirely by industrial load such as primary metal manufacturing. AEP also requested that PJM consider load additions tied to a computer chip manufacturing facility outside of Columbus. PJM's 2025 Long-Term Load Forecast explicitly lists electrification of buildings and vehicles and manufacturing growth alongside data centers as drivers for the AEP zone.
EKPC—East Kentucky Power Cooperative, serving 89 counties across Kentucky—reflected a weather-normalized baseload CAGR of 2.88% over the same period. According to EKPC's 2025 Integrated Resource Plan, the cooperative projects summer peak load growing at 1.14%, driven primarily by electrification and projected growth in data center demand. In October 2025, the Kentucky PSC approved EKPC's new Data Center Power tariff, establishing a framework for serving data centers of 15 MW or greater locating in EKPC's cooperative service territory, suggesting the zone's growth story may accelerate in the years ahead.
How Data Centers Alter Load Profiles
What makes DOM's growth particularly telling is not just the magnitude but the character of it. Baseload growth—the flat, around-the-clock demand that runs independent of weather or time of day—outpaced peak growth consistently across the period, averaging 6.60% annually against a peak average of 5.98%.
Baseload growth... outpaced peak growth consistently.
That divergence is the signature of data center load. Unlike residential or commercial demand, which rises and falls with temperature and daily activity, most data centers run at high utilization 24 hours a day. When baseload grows faster than peak, it means the grid is absorbing a fundamentally different kind of electricity consumer — one that never goes to sleep.
The scale of that concentration is reflected directly in PJM's own forecasting. In 2022, projected data center load growth in the Dominion zone through 2037 stood at roughly 5,700 MW. By 2025, that figure had surpassed 20,000 MW. Those aren't incremental revisions—those are forecasts being rewritten entirely, driven by the explosive growth of hyperscale computing and the rise of generative AI pushing demand beyond anything prior planning cycles anticipated.
Data centers are the headline, but they are not the only force at work. Virginia's energy plan acknowledges that the Commonwealth's growing energy needs are also driven by economic growth as well as the electrification of transportation and industry.
Electrification and Economic Activity Also Contribute to Load Growth
Across the wider PJM footprint, EV adoption and new EV battery plants and gigafactories coming online are adding industrial-scale electric loads that did not exist in prior planning cycles. PJM's own 2024 load forecast noted that rising energy demand across the region is increasingly driven by data center development combined with the accelerating electrification of transportation and industry.
At the time of that forecast, approximately 500,000 light-duty EVs were registered across the PJM footprint—a number S&P Global projects will reach roughly 23 million by 2039. The result is a demand growth story with multiple engines running simultaneously, and DOM sitting squarely at the center of it.
Virginia's own Department of Energy projects that energy demand across the Commonwealth will more than double by 2035, with Virginia's data center hub alone projected to consume 25 GW by that same year.
In short, DOM's 6.50% weather-normalized compound annual growth rate (CAGR) over 2021–2025 is not an outlier or an anomaly. It is the early, measurable signal of a structural demand shift that Virginia's grid—and by extension, PJM's—is only beginning to absorb.
It is the early, measurable signal of a structural demand shift that Virginia's grid—and by extension, PJM's—is only beginning to absorb.
What the Prices Are Saying
The LMP data tells the same story from a different angle. DOM has priced above the PJM-RTO average every single year from 2021 through 2025, and that gap has been widening in step with the data center buildout—not coincidentally, but structurally.
The 2022 spike was a market-wide event, driven by the global energy price shock that followed Russia's invasion of Ukraine, which disrupted LNG markets and pushed natural gas and wholesale electricity prices sharply higher across PJM.
But DOM felt it more acutely than most, and when prices corrected sharply in 2023, DOM's spread above the RTO didn't close with them. It held in 2023, held again in 2024, and by 2025 had widened to its largest point in the five-year window—with DOM day-ahead (DA) prices averaging $60.03/MWh and real-time (RT) prices averaging $60.65/MWh, versus RTO averages of $47.88 and $46.90 respectively.
The 2026 data, covering January through April, pushes that story further. DOM DA is averaging $95.70/MWh and RT $98.47/MWh, with the RT spread above the RTO now sitting at 40.9%. That RT premium is a particularly telling signal: when RT prices run significantly above DA, the market is being surprised by demand that wasn't fully anticipated in the day-ahead market.
The market is being surprised by demand that wasn't fully anticipated in the day-ahead market.
In a zone adding hyperscale data center load at the pace DOM is, that is exactly what you would expect to see. The load data shows it in CAGRs, while the price data shows it in real time.

Similarly, PJM capacity prices have jumped 800% in recent years, consistently hitting and even surpassing price caps set by the grid operator—and still, they have failed to procure enough capacity. Markets are not sufficiently responding to these unprecedented demand drivers.
Why Impressive Renewable Energy Growth Still Can’t Satisfy Data Center Loads
Virginia is not standing still on the supply side. In 2020, Governor Northam signed into law the Virginia Clean Economy Act, setting a mandate to achieve 100% carbon-free electric energy generation by 2045 at least cost for ratepayers. To get there, Dominion has embarked on one of the most ambitious clean energy buildouts in the country.
The centerpiece is the Coastal Virginia Offshore Wind project—a 2.6 GW offshore wind development that, when fully constructed, will provide zero-carbon energy to as many as 660,000 customers at peak output—alongside large-scale utility solar expansion across the state. These are meaningful additions to the grid, and offshore wind in particular offers a more consistent capacity factor than solar, with better alignment to evening and overnight demand periods.
But renewables alone don't resolve the reliability picture, and the reason comes down to the nature of data center load itself. Data centers run at high utilization around the clock — a relatively flat, firm, 24/7 demand profile that is arguably the most difficult load type for intermittent generation to serve. Solar produces power for roughly six to eight hours a day. Wind is variable. Neither can reliably back data center load without storage or other firm capacity behind them.
That tension is why Dominion is simultaneously pursuing renewable buildout while also retaining some gas peakers and actively exploring small modular reactors. The renewable mandate and the reliability requirement are pulling in different directions, and the gap between them is growing thanks to the sheer scale of data center demand growth.
The renewable mandate and the reliability requirement are pulling in different directions, and the gap between them is growing.
The capacity story is further complicated by timing. Coastal Virginia Offshore Wind only began delivering its first power to the grid in March 2026 and is not expected to be fully complete until early 2027, while data center load has been accumulating for years. As Virginia's own House Speaker Don Scott acknowledged, the state "went a long while with more supply than we had demand—now it's flipped upside down."
Renewables are offsetting a meaningful share of energy growth, but the capacity story—particularly the need for firm, dispatchable resources to back a load profile that never sleeps—remains unresolved.
What Data Center Load Growth Means for Transmission, Capacity Markets, and Reliability in PJM
The implications of Virginia’s data center-driven load growth reach well beyond state borders. DOM is PJM's fastest-growing load zone by a significant margin, and the infrastructure strain it is creating—on transmission, on the capacity market, on the interconnection queue—is felt across the entire 13-state footprint. Ratepayers across PJM are already absorbing the consequences, with capacity market prices spiking and residential bills climbing in states well outside Virginia.
On transmission, the pressure is tangible, and the investment response is unprecedented. In 2025 alone, PJM's RTEP process identified 122 new baseline projects to maintain fundamental grid reliability at an estimated cost of $11.8 billion, driven primarily by the proliferation of data centers along with the electrification of vehicles and building heating systems. Among the solutions under consideration is a proposed 525 kV High-Voltage Direct Current transmission link designed to move generation capacity from the southern edge of the PJM system into northern Virginia.
On the capacity market, the story is one of a market being stress-tested by demand it was not designed to absorb at this pace. Both the 2026/2027 and 2027/2028 auctions reflected the same underlying dynamic: forecasted demand growth continuing to outpace new supply, with prices not just hitting, but pushing past the FERC-approved cap. The 2027/2028 auction was the first in which the entire RTO, including Fixed Resource Requirement areas, fell short of the reliability requirement. For the upcoming 2028/2029 auction, FERC approved on April 28, 2026 an extension of the existing price collar as a near-term measure to protect ratepayers while the underlying supply-demand imbalance remains unresolved.
On reliability, PJM has been direct about what this moment requires. The grid operator has established what it calls "clear, transparent guardrails for integrating large new loads under defined conditions," with its Chief Operating Officer describing the work ahead as requiring "bold action" and "intense work by all of us in 2026".
The question grid planners, utilities, and market participants are now grappling with is not whether DOM's demand growth is real, but whether the grid can be built fast enough, and with the right mix of resources, to reliably serve a load that is growing faster than almost anyone planned for. The 2021–2025 period established the trajectory. What comes next will determine whether the grid can keep pace with it.
The question grid planners, utilities, and market participants are now grappling with is not whether DOM's demand growth is real, but whether the grid can be built fast enough, and with the right mix of resources, to reliably serve a load that is growing faster than almost anyone planned for.
Is Battery Storage PJM's Next Chapter?
If ERCOT and CAISO offer a preview of where grid-scale battery storage can go, PJM is still in the early pages of that story. CAISO has 16 GW of installed battery capacity, and ERCOT has nearly 19 GW as of May, 2026. PJM, meanwhile, had just over 400 MW of utility-scale storage online as of Q3 2025. CAISO and ERCOT have each integrated storage as a core reliability tool—a gap PJM can no longer afford to ignore.
A report from the U.S. Energy Storage Coalition, with research conducted by the Brattle Group, found that PJM requires at least 16 GW of energy storage by 2032 and 23 GW by 2040 to maintain system reliability, and that falling short could result in 15 GW of load shed during extreme weather and a 38% rise in electricity costs by 2028. And not only is PJM far behind, but its battery energy storage growth is stalled. Hundreds of storage projects are already stalled in PJM's interconnection queue, with regulatory and market barriers threatening to delay urgently needed capacity.
Not only is PJM far behind, but its battery energy storage growth is stalled.
The policy backdrop adds another layer of complexity. PJM's own forecasting work is actively incorporating distributed solar and battery storage assumptions into its long-term load outlook. But as that analysis reflects, the passage of the One Big Beautiful Bill Act in July 2025 significantly shortened or ended tax credits for solar and storage that had previously been available through the Inflation Reduction Act, adding policy headwinds to an already constrained buildout environment.
PJM has been working to build generation and maintain grid reliability, but demand keeps outrunning the response. In 2025, PJM obtained FERC approval to streamline its Surplus Interconnection Service—the unused portion of interconnection service at existing facilities—specifically enabling battery storage to co-locate at existing points of interconnection, and its Reliability Resource Initiative selected 51 shovel-ready projects totaling over 9,300 MW, five of which are batteries.
Less than a year later, the scale of what was needed had already outgrown that response. In April 2026, 811 new generation projects applied to connect to the grid under PJM's reformed interconnection process, representing 220 GW of proposed capacity, with storage leading at 349 projects totaling more than 67GW.
Less than a year later, the scale of what was needed had already outgrown that response.
Not all of these will be built—state permitting and supply chain constraints remain real obstacles—but the volume reflects the scale of developer interest that demand growth is now attracting. The pace remains well behind a demand trajectory that is not slowing down. The ISOs that moved earliest on storage are now reaping the reliability benefits. Whether PJM can close that gap, and how quickly, may be one of the defining grid questions of the next decade.
Contact Amperon for zone-level demand forecasting and price analytics across the PJM footprint.


.svg)


%20(3).png)
%20(2).png)
%20(1).png)


.png)


.avif)


.avif)

.avif)


.avif)


.avif)
%20(15).avif)

.avif)
%20(10).avif)

.avif)


.avif)

.avif)


.avif)


