

On September 6, ERCOT came close to rolling blackouts for the first time since 2021 — the year winter storm Uri hit the state. But this latest trouble was caused by summer, not winter, weather.
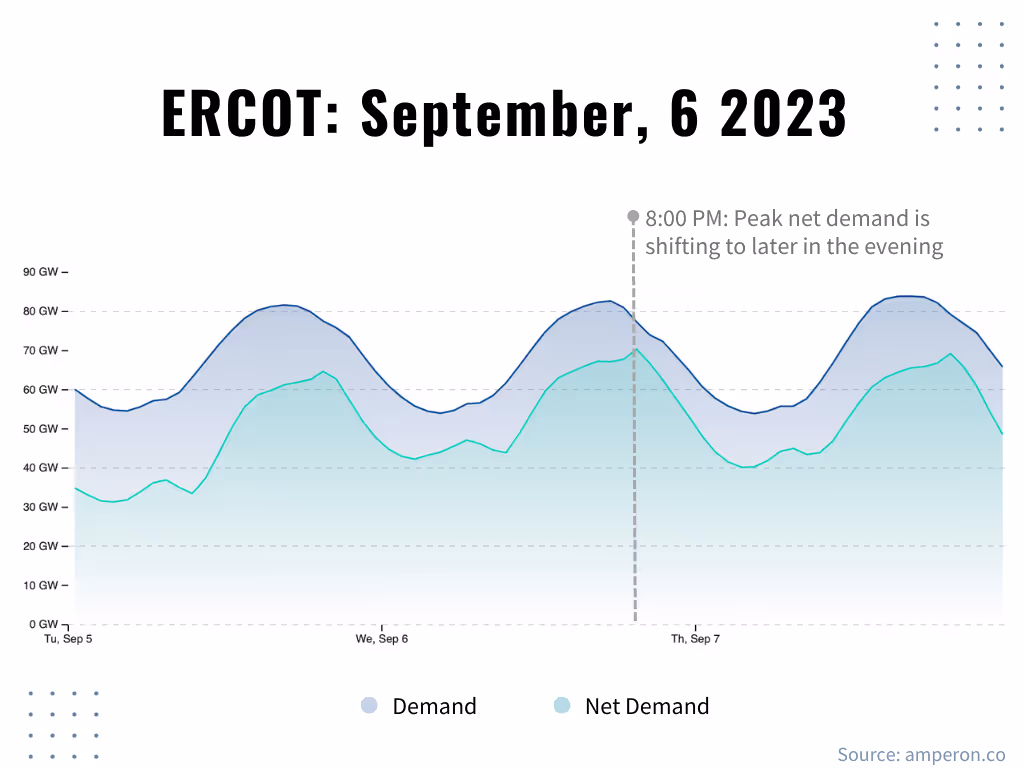
Specifically, it was the result of late summer conditions, which are creating a unique risk for power shortages in regions with significant renewable power generation. On September 6, the sun set in central Texas at 7:45 p.m., which meant solar generation began to fall off about two hours earlier, just as demand increased with people arriving home from work and turning on power-hungry appliances, like air conditioning.
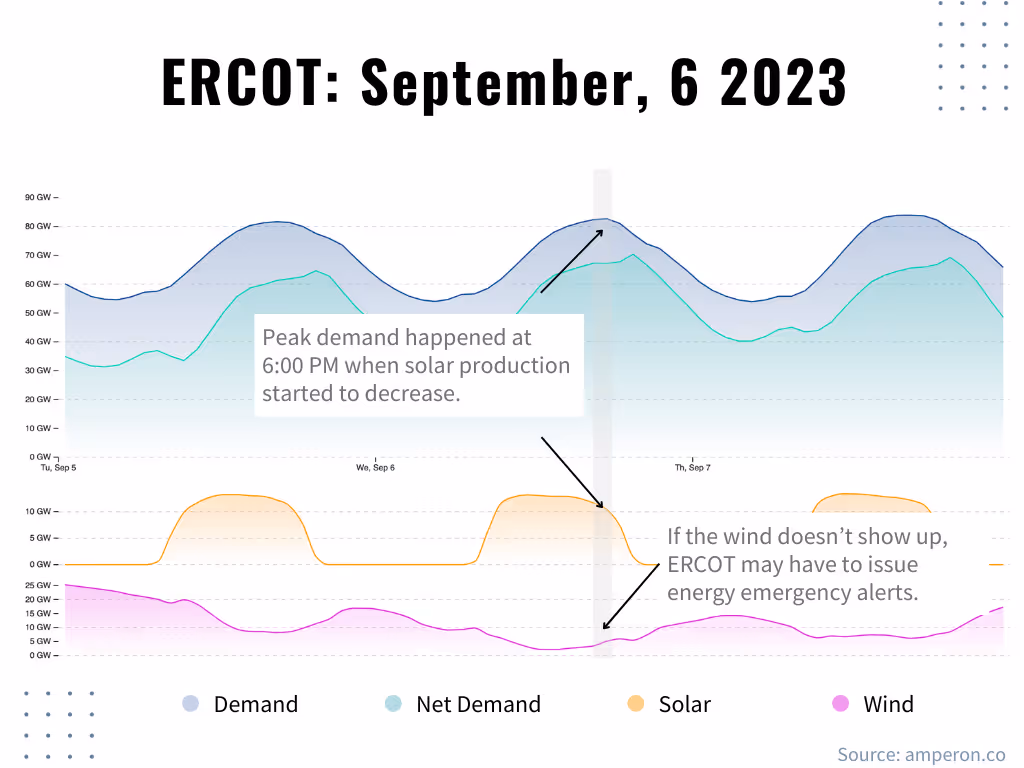
The wind didn’t pick up that evening, as it typically does in Texas, and the temperature outside stayed around 100°F until after dark. As a result, air conditioners ran even harder than usual, while wind turbines across the region generated less electricity. (See the graph below.)
When reserves fell below 1,750 MW around 7 p.m., it triggered a Level 2 Energy Emergency Alert, setting the stage for demand response events with large industrial power users and coming just one level away from controlled outages.
The combination of factors that aligned on September 6 is the reason the riskiest hours for many utilities shifts at this time of year from hours ending (HE)16-18 to HE19-21.
And it’s not just a Texas thing.
The Generation Mix Beneath the Gap
In September 2023, solar power provided 7.43% of the average energy mix in ERCOT, and wind provided 23%. Five years earlier, in September 2018, average solar contribution was just 0.86% and wind was only 18%. The uptick in renewables has replaced coal-fired generation, which decreased from 24.8% of the total mix down to 16.7% over the same period.
ERCOT isn’t the only system with increasing renewable supply, of course. CAISO went from 14% solar to 20% between 2018 and 2022, giving its net load graphs the characteristic “duck curve,” reflecting lower net load in the afternoon when the sun is brightest, and then increasing sharply into the evening until demand drops off around 9 pm. (See graph below.)
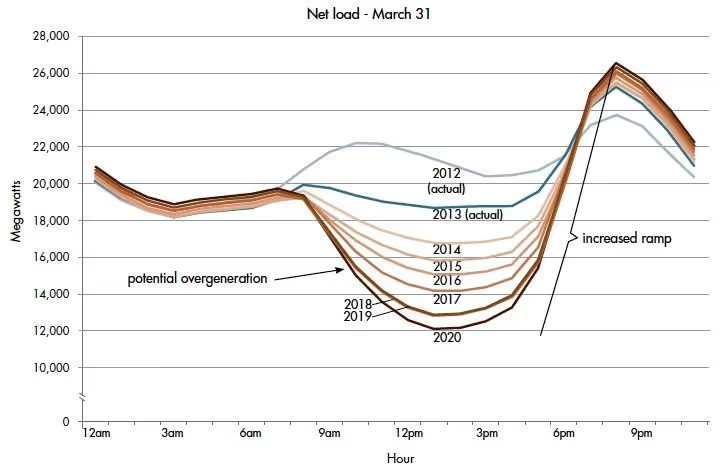
California’s wind power production went down from 7.2% to 6.9% over the same period, as did hydro (13.5% to 8.7%) and nuclear (9.4% to 8.7%). As a result, California faces a similar risk as ERCOT. Other ISO’s will likely face similar scenarios soon. MISO, for example, only began adding significant solar in 2021, reaching 0.3% of the region’s mix. But by 2022, solar had grown to 1.22% and wind was at 16%, up from 8% in 2018. Like the other two regions, MISO reduced coal-fired generation from 46.8% to 33%.
The increasing percentage of renewables is good for reducing carbon emissions in the atmosphere, but it increases the risk of events like September 6. Blackouts are one risk, but there are also financial risks to utilities that get caught off guard and need to purchase on the spot market.
1 2023 figures were not available for CAISO or MISO at the time of this writing.
What’s the Solution?
As mentioned above, wind power generation often increases in the late afternoon and early evening, just as solar production begins to tail off. This is a fortunate coincidence resulting from temperature differences in the air that build over the course of the day — a phenomenon known as “diurnal wind variation.” But when the wind is unusually low, due to pressure gradients the dip in expected wind power is a risk. (See the graph below.)
“High pressure settled over the middle parts of the region, which led to less wind,” said Dr. Mark Shipham, Amperon’s Chief Meteorologist. “So we saw the wind starting to underperform during the afternoon and the sun beginning to set right as temperatures reached 100 degrees, 5-10 degrees warmer than average for that time of year, causing tight conditions on the grid.”
In the long term, power storage could be the answer for bridging supply-and-demand gaps in shoulder months when the sun is setting earlier but temperatures are high enough to cause significant demand for air conditioning. But in the near term, utilities need reliable forecasting to ensure they are properly hedged in advance with their energy purchases, and to be prepared to engage demand response capacity, if needed.
Accurate Net Demand Forecasting
Traditional demand forecasts no longer give enough information to utilities. With renewables having significant impacts on energy supply and markets, utilities need net demand forecasts that factor in the amount of wind and solar generation that is expected to match up to or fall short of the projected demand.
Producing accurate solar or wind forecasts is about much more than just knowing whether the sun will be shining, or the wind will be blowing. “Even small variations in cloud coverage, humidity, wind speed, wind direction, temperature or precipitation can affect generation,” Shipham said. “With better information about the amount of solar and wind that will be available on the grid at any given time, companies can more effectively integrate renewables into their energy-management strategies.”
As a dedicated forecasting company with better data and expertise, Amperon provides forecasts that are more accurate — and reach further into the future — than those provided by ISOs. For instance, our demand forecasts for September 6 were 2.3 times more accurate than those supplied by ERCOT when comparing the day-ahead forecasts. Plus, our net demand forecasts for September 6 were available 14 days in advance, compared to 7 days for ERCOT’s. On average, Amperon’s net demand forecasts are 25% more accurate than ERCOT’s, and in November we began offering 14-day net demand forecasts to customers in CAISO, PJM, and SPP.
Conclusion
Ultimately, there’s nothing utilities can do about the weather. The sun is going to shine when it shines, and sometimes the wind isn’t going to blow. Power storage solutions are trying to catch up to the gap caused by the increasing reliance on (and the importance of) renewables in the energy mix. But the build-out of renewables has a head start and is picking up steam.
That means for the foreseeable future, accurate net demand forecasting will be critical for managing the supply gap risk that occurs in late spring and early fall. Plus, as storage solutions come online, net demand forecasting will be necessary for managing charge and discharge cycles, and for understanding the effects on market supply and pricing.
Contact us to discuss how your organization could benefit from better net demand forecasting.
.avif)


.svg)


%20(3).png)
%20(2).png)
%20(1).png)


.png)


.avif)


.avif)

.avif)


.avif)


.avif)
%20(15).avif)

.avif)


.avif)


.avif)

.avif)


.avif)


