Product Launch
New Product Alert! Grid Demand Mid-Term Forecasting
Learn More

Reminiscing on the summer’s heat waves... so far

The energy grid has been put to the test, with summer demand already exceeding expectations in some regions. But summer is not over yet, let's review.

Arianna Goldstein
July 30, 2024

Summary

1
2
3
4

As anticipated in our Summer 2024 Demand Expectations, it has indeed been a Cruel Summer so far. Heat waves have dominated ISOs in North America, leading to record-breaking temperatures in numerous cities and even a landfalling hurricane that caused week-long power outages. The energy grid has been put to the test, with summer demand already exceeding expectations in some regions. But summer is not over yet. With a short break from the heat, thanks to recent milder temperatures, let’s take a look at what we’ve seen so far.  

CAISO

It has been a scorching summer for CAISO. The heat began intensely in mid-June and has remained consistent throughout July. The heat is widespread throughout the state, with inland cities experiencing the most extreme temperatures exceeding 100 degrees for days on end. Temperature records have been broken in cities throughout the West.  

  • Palm Springs recorded its hottest temperature ever at 124 degrees.
  • Death Valley reached 128 degrees on July 6th, breaking the record for that day.
  • Las Vegas, a CAISO neighbor, saw its hottest temperature on record at 120 degrees on July 7th. The city also experienced three consecutive days with temperatures above 118 degrees and seven days in the first week of July where daily high temperature records were tied or broken.

Excessive heat warnings have been continuously issued by the National Weather Service due to temperatures reaching over 110 degrees and nighttime lows above 80. The heatwaves have heightened the risk of wildfires, as seen with the destructive Park Fire currently ablaze in California.

This month, CAISO has seen its highest demand peaks of the summer so far. In 2023, demand peaked on August 16th at 44.5 GW, which has already been surpassed this year.

  • Early July: Peak demand was 43.7 GW
  • July 23rd: Peak demand was 44.6 GW
  • July 24th: Peak demand was 44.8 GW

In this extreme heat, Amperon consistently outperformed CAISO’s demand forecast. For example, Amperon’s forecast for July 23rd was 1.52 times better than CAISO’s forecast with an Absolute Percentage Error (APE) of 2.22% at the peak demand hour. These are the highest demand peaks of the summer so far, with more time to reach CAISO’s forecasted July peak of 46,244 GW.

Despite the heat, CAISO has not issued any Flex Alerts this summer during these triple-digit heat waves. In the past two years, CAISO has added 11 GW of clean energy to their grid, with a significant amount being battery storage. These additions have ensured sufficient supply to meet power demand during scorching days, with battery dispatch reaching approximately 7.5 GW at peak demand on July 24th, likely setting a new dispatch record. As of July 10th, CAISO has 9 GW of battery storage connected to the grid, nearly 4.5 GW more than this time last year. Batteries are added to the grid to help ensure supply stability at volatile times, and we are seeing these succeed firsthand in CAISO this summer.  

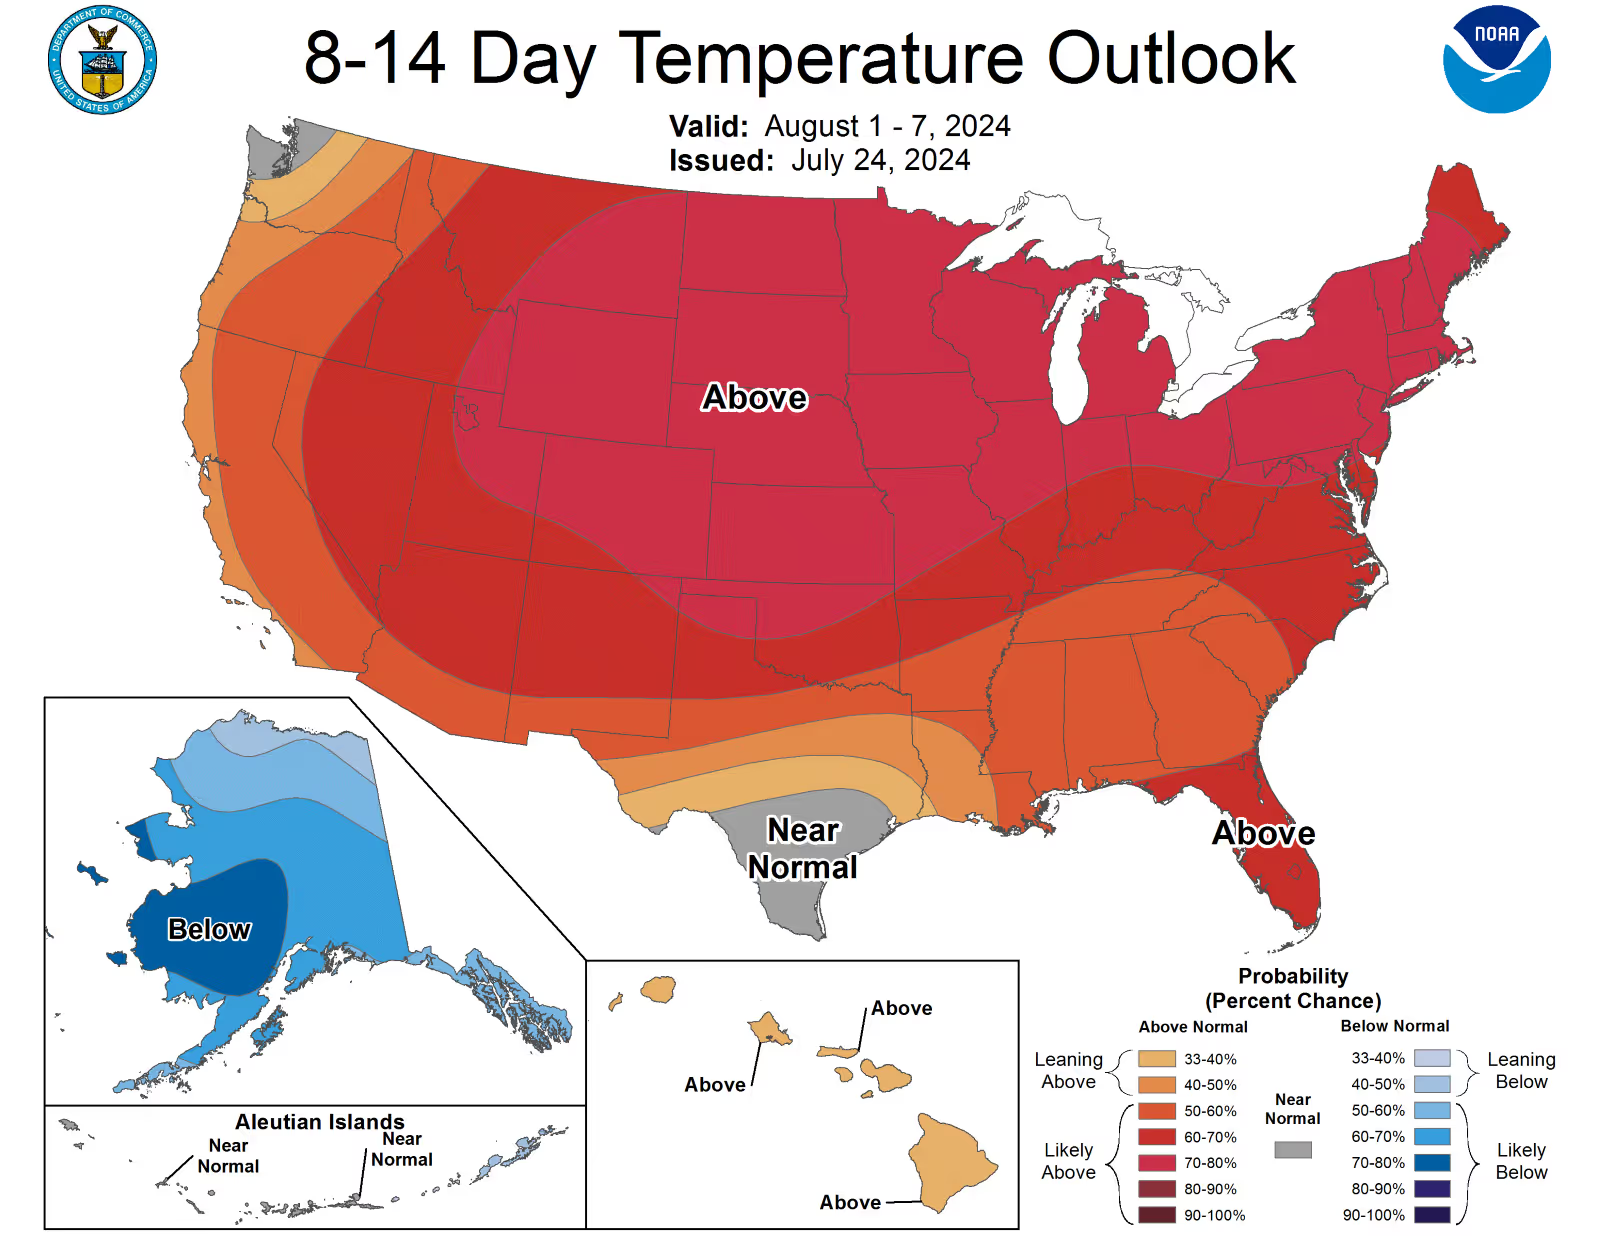
Temperatures are expected to soar once again in the first week of August, with predictions well above normal for this time of year. Anticipate more high demand in CAISO and potential grid stress, especially when renewable generation is weak.

Northeast

Mid-June and July have been exceptionally steamy in NYISO and ISONE. As a Bostonian, if this heat is the new summer normal, more houses and apartments need central AC installed.  

More records were broken during the mid-June heat wave.  

  • Bangor, Maine reached 96 degrees on June 20th, a temperature not seen in nearly 100 years.
  • Boston, Massachusetts tied for the hottest summer ever. High temperatures stayed in the mid to high 90s for days. On June 19th, the city recorded its highest temperature ever for that date at 98 degrees.

The NYISO forecasted demand peak for the summer is 31,541 MW. The highest demand peak so far was around 29 GW on July 8th. Although, this settled higher than both Amperon and NYISO’s forecast, Amperon’s peak demand forecast still outperformed NYISO’s, being 1.07 times more accurate. The ISONE forecasted demand peak for the summer is 24,553 MW. On July 16th, demand peaked around 24.2 GW. Amperon’s APE at this peak demand hour was 0.51% which was 2.06 times better than ISONE’s forecast.  

The sustained high temperatures caused typical grid stress and elevated energy prices across the evening peak in several zones. With another heat wave expected going into the first week of August, both regions still have time to reach their expected summer peaks.

PJM and MISO

Three words: Hot weather alert!!! PJM issues these alerts when temperatures are expected to surpass 90 degrees, preparing transmission and generation facilities for increased electricity demand.  

  • Mid-June: Saw the first of the PJM heat waves. Friday, June 21st, was the hottest day of this five-day stretch, with demand peaking at 147.5 GW. Amperon’s APE at this hour was 0.82%, which was 1.46 times better than PJM’s forecast at this maximum demand hour.
  • Mid-July: Demand reached new heights. On July 15th and 16th, peak demand exceeded PJM’s summer demand outlook of 151 GW. Amperon’s forecast outperformed PJM’s demand forecast, with APE of 1.09% on the 15th and 1.45% on the 16th at the peak demand hours. Amperon’s average MAPE (Mean Absolute Percentage Error) for these days was 1.88%, beating PJM’s MAPE.  

The National Weather Service issued excessive heat warnings for these events since high temperatures were expected to be in the high 90s or even above 100 degrees in certain regions. Washington DC experienced a record-breaking three-day stretch of temperatures 101 degrees or higher July 14-16, which has not been seen since 1930!

Additionally, MISO has also faced significant heat waves throughout the summer. MISO’s summer demand forecast peak is 123 GW, with even more generation available to meet this high demand. So far, MISO reached a peak of approximately 117.6 GW on July 15th. At this time, Amperon’s APE was 0.14% for the peak demand hour, HE17. The next two weeks are expected to be much hotter than normal for the central US, meaning there is still time for MISO demand to climb even higher.  

AESO

Wildfires have been a persistent issue during the past few summers in Alberta. Last year, the sky in NYC turned orange from the wildfire smoke traveling all the way from Alberta. This year, wildfires are once again causing problems, combined with the intense summer heat waves—a double whammy. The pattern continues with record breaking heat throughout AESO.

  • Edmonton experienced the longest heat wave on record, with seven consecutive days of high temperatures above 30 degrees Celsius in mid-July.  

To put this into perspective, both cities usually average fewer than four to five days a year where high temperatures reach 30 degrees Celsius. This summer, both Edmonton and Calgary have seen temperatures well above this threshold for days on end.

On the hottest day, July 22nd, Amperon's APE at the peak demand hour (HE17) was just 0.03%, significantly outperforming AESO’s forecast for that day. On July 17th, which saw the second highest demand of this period, Amperon’s peak demand forecast was approximately 1.08% more accurate than AESO’s.

The heatwave season is far from over. While the grid enjoyed a bit of relief this past week with cooler temperatures, the forecast predicts a return to intense heat for much of the country this week. Regions across the country must brace for continued high demand and potential grid stress. Amperon's forecasts are crucial in navigating the extreme heat ahead, ensuring that grids can manage peak loads and maintain stability during the hottest periods.

NOAA 8-14 day temperature outlook map for August 1-7, 2024, showing above-normal temperatures across most of the United States
Source: CPC NOAA

AI-driven Forecasting

Our advanced machine learning methodology delivers the accuracy you need to optimize operations and maximize profits.

  • 40K weather points from 4 vendors
  • 15-day short-term forecasts that update sub-hourly
  • Globally available
  • Leading UI/UX or API delivery
Book a demo

Want 3x more accurate forecasts? Let's talk.

Book a demo

Related articles

Left arrow icon for navigationRight arrow icon for navigation
Blog
December 8, 2025
European Power Traders Finally Get One-Stop Forecasting
Open article
Blog
December 6, 2025
The Pacific Northwest Risks a 6 GW Shortfall This Winter
Open article
Blog
December 5, 2025
With Millions On the Line, Amperon Called Cold Snap 33 Days Out
Open article
Blog
December 5, 2025
Chilean Solar and Wind Asset Owners Face Hourly Reporting Under New Market Structure
Open article
Blog
December 5, 2025
Can PJM Keep Up with Exponential Load Growth?
Open article
Blog
December 5, 2025
US Winter Weather Outlook 2025–2026: Mild on Paper, Volatile in Practice
Open article
Blog
December 5, 2025
Ontario’s Day-Ahead Market is a Renewables Profitability Test
Open article
Blog
December 5, 2025
US Solar and Wind Curtailment Is Exploding
Open article
Blog
December 5, 2025
Navigating the RTC+B Paradigm Shift
Open article
Case study banner reading “Nailing MISO’s Fall 2025 Coincident Peak” with a computer displaying grid demand forecasts
Blog
December 5, 2025
Nailing MISO's Fall 2025 Coincident Peak: A Week-Ahead Perfect Call
Open article
Amperon MTF model visualization displaying market trends and forecasts
Blog
December 5, 2025
Unlocking Intelligent Term Trading and Seasonal Planning  
Open article
Blog post header with palm tree in hurricane winds asking Why Has This Hurricane Season Been So Quiet with Amperon branding
Blog
December 5, 2025
Why Has This Hurricane Season Been So Quiet?
Open article
Table showing parallel flow congestion scenarios across different energy markets including ISO/RTO, WEIM, WEIS, Markets+, and EDAM with scheduled delivery systems and mitigation strategies
Blog
December 5, 2025
CAISO Breaks the Transmission Hedge
Open article
Amperon blog post graphic asking High ERCOT Demand, Low Wind, and No Price Spike? with load forecast chart for August 18, 2025
Blog
December 5, 2025
High ERCOT Demand, Low Wind, and No Price Spike?
Open article
ISONE May hourly average load comparison chart showing data from 2023, 2024, and 2025 with peak loads around 13,534 MW at HE17-18
Blog
December 5, 2025
Electrification and BTM Solar: Reshaping Demand in ISO New England
Open article
Line graph showing MISO Net Load from 2022-2025 comparing hourly load patterns ranging from 50,000 to 90,000 MW across 24-hour period
Blog
December 5, 2025
The Rise of the Duck Curve in ERCOT: A Shift in Net Demand Peak and the Future of Solar Power Integration
Open article
Amperon market analysis titled Where's the Chaos? ERCOT's Surprisingly Quiet Summer with curved line graph showing peak demand trends from 2022-2025
Blog
December 5, 2025
Where’s the Chaos? ERCOT’s Surprisingly Quiet Summer
Open article
Amperon forecasted load versus prediction time by weather vendor chart for PJM on June 24, 2025, showing settled demand at 158.2 GW with multiple vendor forecasts (ENS_1, NBM, DTN, AG2)
Blog
December 8, 2025
PJM Breaks 10-Year Peak Load Record — and Amperon Saw It Coming 7 Days Out
Open article
Blog
December 8, 2025
PJM Forecast: June 23–25 Heat Wave May Shatter Summer Expectations
Open article
Blog
December 8, 2025
ISONE’s First Heat Spike of Summer- and Amperon Nailed It
Open article
Amperon whitepaper cover titled Cost of Uncertainty: The Challenges and Value of Accurate Price Forecasting with download button, dated March 2025
Blog
November 18, 2025
Why Wholesale Electricity Prices are ESPECIALLY Volatile in Texas
Open article
Blog
June 3, 2025
Powering Profitable Growth for Retail Electricity Providers: Turn Load Forecasting into Your Competitive Edge
Open article
Blog
November 18, 2025
Navigating ERCOT’s 4CP Program: Key Updates and Strategic Preparation for 2025
Open article
Amperon promotional banner announcing sub-hourly grid forecasts for European TSOs now available, featuring transmission tower with geometric orange and blue design elements
Blog
November 18, 2025
Europe’s Shift to 15-Minute Power Markets: How Amperon Helps You Prepare for Market Evolution
Open article
Amperon blog post graphic titled "The Shape Shift: How Texas Net Demand Transitions from Shoulder to Summer" with wind turbine image
Blog
November 18, 2025
The Shape Shift: How Texas Net Demand Transitions from Shoulder to Summer
Open article
Amperon presentation slide titled "ERCOT's Evolving Price Dynamics 2021-2024 Analysis" with sunset transmission tower image
Blog
November 18, 2025
ERCOT’s Evolving Price Dynamics [2021-2024 Analysis]
Open article
A promotional image announcing the introduction of real-time grid price forecasts now live in ERCOT, featuring Amperon branding
Blog
November 18, 2025
Amperon Expands Forecasting Capabilities with Real-Time Price Predictions in ERCOT
Open article
Blog
November 18, 2025
MISO’s VOLL Change Could Reshape Scarcity Pricing and Reliability Signals
Open article
Blog
November 18, 2025
Why Behind-the-meter Solar Complicates Spring Forecasting
Open article
Comparison table showing solar and wind forecasting capabilities across Machine Learning, Physics-based, and Amperon (ML+PB) approaches for partial asset metadata, soiling, equipment degradation, biased weather, and curtailment
Blog
November 18, 2025
How to Forecast Energy Generation for Wind or Solar Assets
Open article
Day-ahead grid MAPE summary table for 2024 showing 12-month average comparison of ISO MAPE, Amperon MAPE past models, current models, and improvement percentages across multiple ISOs (AESO, CAISO, ERCOT, ISONE, MISO, NYISO, PJM, SERC, SPP, CH, DK, ES, IE)
Blog
November 18, 2025
Always Innovating: Amperon’s New Techniques to Improve Energy Forecasting
Open article
Amperon recap slide for April 7 titled "Why prices in ERCOT soared to $4000 per MW" with pastoral field landscape at golden hour
Blog
November 18, 2025
High Net Demand and Outages Caused Recent Price Spike in ERCOT
Open article
Amperon ebook promotional banner "Price Forecasting: Cost of Uncertainty - The Challenges and Value of Accurate Price Forecasting" with free ebook download button on gradient blue-green background
Blog
November 18, 2025
Are ERCOT’s morning ramp DA prices really higher than summer?
Open article
Infographic titled "Types of Data Relevant to Both Solar and Wind Assets" showing three categories: Nameplate Capacity, Location of Asset, and Historic Curtailment with wind turbines and solar panels imagery
Blog
November 18, 2025
Inside our Data: Intro to Renewable Asset Data
Open article
Amperon promotional slide "Adapting to OMIE's 15-Minute Transition: How Granular Forecasts Can Help You Stay Ahead" with laptop showing asset-level solar sub-hourly forecast for January 12, 2025
Blog
November 18, 2025
Adapting to OMIE’s (Portugal and Spain) 15-Minute Transition: How Granular Forecasts Can Help You Stay Ahead
Open article
Blog
November 18, 2025
What the beginning of daylight savings time means for peak pricing
Open article
Amperon presentation slide "How the Grid Changed in 2024" with aerial view of large-scale solar farm installation in agricultural setting at sunset
Blog
November 18, 2025
How the Grid Changed in 2024
Open article
Amperon recap slide for February 14-20 titled "Another cold week on the grid, another good week for Amperon's demand forecasts" with wind turbines in snowy landscape
Blog
November 18, 2025
Another cold week on the grid, another good week for Amperon’s demand forecasts
Open article
Blog
November 18, 2025
The Future of Western Power Markets: Why Implementing a Day-Ahead Market Matters
Open article
Blog
November 18, 2025
Harnessing the power of sub-hourly and hourly forecasts for wind assets
Open article
Blog
November 18, 2025
Forecasting for the Super Bowl: How much does the big game really affect demand?
Open article
Amperon promotional banner stating "33% more accurate in MISO" with blue gradient background and solar panels with wind turbines imagery
Blog
November 18, 2025
Best Demand and Net Demand Forecasting Calls to End 2024
Open article
Amperon slide featuring Punxsutawney Phil prediction reference titled "What Punxsutawney Phil's prediction for 6 more weeks of winter really means for the grid" with snowy groundhog image
Blog
November 18, 2025
What Punxsutawney Phil’s prediction for 6 more weeks of winter really means for the grid
Open article
Blog promotional graphic on navy background titled "New Blog: Why a hybrid regression/ML approach outperforms in energy forecasting" with layered visualization showing Linear Regression, Boosted Trees, and Additional secondary models
Blog
November 18, 2025
Why a hybrid regression/ML approach outperforms in energy forecasting
Open article
Blog
June 3, 2025
Europe 2024 Best Amperon Forecasting Calls and Trends to Watch
Open article
Title slide reading "Part 1: Inside Our Data: The Importance of Granular Weather Data" by Lily Bowdler from Amperon
Blog
November 18, 2025
Inside our Data: The Importance of Granular Weather Data
Open article
Bar chart showing 2025 Highest ISO Demand Levels So Far across four ISOs: ERCOT (68.9 GW), PJM (126.8 GW), MISO (97.9 GW), and SPP (43.1 GW)
Blog
November 18, 2025
Déjà vu? With one cold snap down, will we have a repeat of last MLK weekend?
Open article
Blog promotional slide "The first winter cold snap is here, but will it break records?" with laptop displaying PJM weather data showing 5-year, 10-year, and 30-year normals for various cities
Blog
November 18, 2025
First winter cold snap is here, but will it break records?
Open article
Blog
June 3, 2025
Looking Back (and Ahead): A Year-end Q&A with Amperon CEO Sean Kelly
Open article
Line graph comparing Ireland Wind Generation forecasts for August 20-26, showing Actual Wind, Amperon Day Ahead Wind Forecast, and EirGrid Day Ahead Wind Forecast (duplicate of image 43)
Blog
November 18, 2025
How strong winds in Ireland left power market stakeholders exposed
Open article
Line graph of CAISO demand for Indigenous Peoples Day 2024 (October 11-14), showing Duck Curve pattern and comparing Amperon Day Ahead, ISO Day Ahead, and Actuals
Blog
November 18, 2025
Forecasting for the holidays: How holidays affect demand patterns
Open article
Blog
June 3, 2025
When tech buys nuclear, who wins?
Open article
Blog
November 18, 2025
Unlocking new standards in solar forecasting to maximize asset efficiency
Open article
Marketing graphic titled "What's Happening with Price Forecasting? A Q&A with Amperon CEO Sean Kelly" featuring professional headshot of Sean Kelly
Blog
November 18, 2025
What’s Happening with Price Forecasting? A Q&A with Amperon CEO Sean Kelly
Open article
Blog
November 18, 2025
Taking Advantage of Amperon’s Net Demand Forecast on Snowflake
Open article
Line graph showing ES (Spain) Demand for August 15 Feast of Assumption, with table comparing Peak Demand, Amperon APE, and ES APE percentages across four dates, plus lower panel showing electricity production and spot prices
Blog
November 18, 2025
2024 Energy Demand Trends: What Happened During 3 Recent EU Holidays
Open article
Blog
June 3, 2025
PJM Capacity Auction: Record Pricing and Delays
Open article
Multi-panel visualization showing ERCOT Demand for July 1-5, including line graphs comparing Amperon and ERCOT forecasts, data tables showing MAPE percentages for different dates, and gauge charts showing average MAPE (1.02% AMP, 1.69% ISO)
Blog
November 18, 2025
Amperon’s best energy forecasting calls for Summer 2024
Open article
Marketing text overlay on transmission tower background stating "Amperon's new price forecast tackles ERCOT's volatility and helps market participants mitigate risks"
Blog
November 18, 2025
Amperon’s new price forecast tackles ERCOT’s volatility and helps market participants mitigate risks
Open article
Marketing graphic announcing "Expanding Amperon's coverage on Snowflake" for Demand and Net Demand across North America and Europe ISO/TSOs, featuring screenshot of Snowflake marketplace interface
Blog
November 18, 2025
Expanding Amperon’s coverage on Snowflake: Demand and Net Demand for North America and Europe ISO/TSOs
Open article
Video thumbnail from webinar titled "Powering Data-Driven Decisions: Enhance Your Energy Trading Game with Amperon + Snowflake" featuring Amperon and Snowflake logos, dated September 26, 2024, with transmission tower image and video progress indicator show
Blog
November 18, 2025
Powering Data-Driven Decisions: Enhance your energy trading game with Amperon & Snowflake
Open article
Photograph of single wind turbine on hilltop with autumn-colored foliage in foreground against clear blue sky
Blog
November 18, 2025
Analysis of spring curtailments in preparation for fall
Open article
Marketing graphic announcing "Introducing Asset-Level Wind Short-Term Forecasts" with photograph of wind turbines against mountain landscape backdrop
Blog
November 18, 2025
Expanding generation forecast capabilities into wind
Open article
ERCOT West Zone Net Demand Short-Term Forecast for August 11-13, 2024, showing three stacked area graphs for Net Demand, Solar Generation, and Wind Generation, with explanatory text about negative net load, curtailments, and congestion implications
Blog
November 18, 2025
Granular insights from grid net demand forecasts: Importance of zone-level forecasting
Open article
Blog
December 2, 2025
Why solar forecasts and accuracy metrics are a big deal
Open article
Satellite view from space showing large hurricane system with visible eye wall approaching Caribbean islands, showing Earth's curvature against black space background
Blog
November 18, 2025
Weaker hurricane season due to Saharan dust
Open article
Close-up photograph of solar panel array showing dust, dirt, and debris accumulation on photovoltaic panel surfaces, demonstrating need for maintenance
Blog
November 18, 2025
Hailstorms: How they can impact your solar farm
Open article
Nighttime satellite image showing hurricane system with well-defined spiral structure making landfall on southeastern United States coastline with visible city lights
Blog
November 18, 2025
Forecasting for SERC During Tropical Storm Debby
Open article
Photograph of dark chalkboard filled with mathematical equations, formulas, and diagrams including algebraic expressions, chemical structures, geometric drawings, and calculus notations written in white chalk
Blog
November 18, 2025
The different kinds of forecasting metrics
Open article
Blog
November 18, 2025
Amperon’s industry-leading forecasts now available to transact on the Microsoft Azure Marketplace
Open article
Aerial photograph of wind farm installation with three large white wind turbines on rolling green hills with mountains in background and scattered buildings in rural landscape
Blog
November 18, 2025
Reminiscing on the summer’s heat waves... so far
Open article
Marketing graphic announcing "Introducing Solar Sub-Hourly Generation Forecasts" with photograph of solar panel installation on ground-mounted framework in grassy field
Blog
November 18, 2025
Harnessing sub-hourly solar forecasts for power markets trading
Open article
Blog
November 18, 2025
Amperon’s methodologies: AI-powered forecasting for the energy transition
Open article
Blog
June 3, 2025
The Double-Edged Sword: Using LLMs in Electricity Market Forecasting
Open article
Satellite image of two tropical cyclone systems near Asian coastline showing clear hurricane eyes and spiral cloud formations over ocean waters with land mass visible on left side
Blog
November 18, 2025
Advanced stress testing for extreme weather
Open article
Blog
June 3, 2025
Enabling Amperon’s short-term grid forecast with Snowflake
Open article
Upward angle photograph of tall electrical transmission tower structure against blue sky with white clouds, showing multiple levels of power line connections and lattice framework construction
Blog
November 18, 2025
Amperon’s best forecasting calls this Spring
Open article
PJM heat wave peak demand forecast comparison table showing Amperon APE vs PJM APE for June 18-23
Blog
November 18, 2025
PJM Heatwave Analysis: Forecasting for 90-degree heat and a new federal holiday
Open article
Seattle city skyline at night featuring the Space Needle with illuminated buildings
Blog
November 18, 2025
A deep dive into what happened MLK weekend in the Pacific Northwest and West Coast
Open article
30-year temperature normals table showing forecasts for cities from Newark to Rockford, June 12-26
Blog
November 18, 2025
June 2024 heat wave - PJM
Open article
Houston demand chart showing May 16 power outage affecting 1 million people with Amperon's weather actuals vs actual load
Blog
November 18, 2025
Storm Analysis: ERCOT’s intense may weather
Open article
Amperon blog header image asking "What is the true carbon impact of your renewable assets?" with solar panels and wind turbines
Blog
November 18, 2025
What is the true carbon impact of your renewable assets?
Open article
White electric fan with yellow and blue ribbons blowing against bright yellow background
Blog
November 18, 2025
Record summer heat is coming, is the grid – and your company – prepared?
Open article
Blog
June 3, 2025
The Western Interconnection’s big day-ahead decision
Open article
Amperon promotional banner introducing Ensemble Forecast and Advanced Weather Package with laptop display
Blog
November 18, 2025
Introducing Amperon's Ensemble Forecast, NBM Integration, and Advanced Weather Package
Open article
Aerial view of large-scale solar panel farm with organized rows in rural landscape
Blog
November 18, 2025
Coincident peak season is coming
Open article
Desert landscape with red sand, sparse vegetation, and blue cloudy sky
Blog
November 18, 2025
WRAP: New forecasting requirements for Western states’ resource adequacy coalition
Open article
Magnifying glass on business charts and graphs with eyeglasses, representing data analysis
Blog
November 18, 2025
Amperon’s 6 best forecasting calls in 2024 so far
Open article
Power transmission towers and lines crossing snow-covered winter landscape under blue sky
Blog
November 18, 2025
How stable is our grid?
Open article
Total solar eclipse showing sun's corona around dark moon disc against black sky
Blog
November 18, 2025
How the solar eclipse will affect grid stability
Open article
Blue ethernet cable with US hundred dollar bills representing energy cost savings and electricity pricing
Blog
November 18, 2025
The economics of the clean energy transition
Open article
Blog
June 3, 2025
How weather impacts energy demand & prices
Open article
Groundhog (marmot) standing on snow looking alert, associated with weather prediction tradition
Blog
November 18, 2025
How Punxsutawney Phil’s predictions affect the energy grid
Open article
Blog
November 18, 2025
Navigating error measurements for wind and solar generation - the case for cnMAE
Open article
Blog
June 3, 2025
Unlocking solar generation insights with Amperon's renewable forecasts
Open article
Blog
June 3, 2025
Amperon's 2023 Recap
Open article
Blog
June 3, 2025
Morning Ramp Ups and Weather Misses: ERCOT Winter Storm Recap
Open article
Blog
June 3, 2025
Cold Winter Storm Could Bring Trouble to ERCOT
Open article
Blog
June 3, 2025
The Duck Curve and Utilities’ Emerging Seasonal Risks
Open article
Blog
June 3, 2025
Why Advanced Forecasting is Needed for a Solar Powered Future
Open article